
- PRICING
- LIVE QUOTES
- LEARN
- HELP


EN
First National Bank Alaska (FBAK) Succession Plan Keeps Valuation Questions In Focus
Leadership transition and why it matters for First National Bank Alaska stock
First National Bank Alaska (FBAK) just announced a planned leadership shift for January 2027, with long-time CEO, President and Board Chair Betsy Lawer moving into an Executive Chair role.
Darren Franz has been appointed as the next CEO and President, and several existing senior leaders are set to take on expanded responsibilities. For shareholders, this is essentially a succession story that leans on familiarity rather than a reset of the bank’s direction.
First National Bank Alaska’s leadership news lands at a time when momentum has been quietly building, with a 30 day share price return of 4.07% at a last close of US$326.60 and a 1 year total shareholder return of 27.83%. The 3 year total shareholder return of 120.31% and 5 year total shareholder return of 99.61% point to a long running compounding story that investors are already pricing into the stock.
Capitalize on the leadership stability story at First National Bank Alaska by scanning a hand picked 31 resilient stocks with low risk scores that may appeal to investors who prioritize resilience and governance continuity.With First National Bank Alaska up 27.83% over the past year and trading at US$326.60, the 28% intrinsic value discount flag raises a sharper question: How tight is that gap to fair value really?
Preferred P/E of 12.4x: Is it justified for First National Bank Alaska?
On the surface, First National Bank Alaska looks cheap on an intrinsic value screen, with the SWS DCF model flagging a 28.3% discount to an estimated future cash flow value of $455.33 per share against the last close at $326.60.
That same picture gets more mixed when you check the market’s usual shortcut. FBAK is described as expensive on a P/E basis, trading at 12.4x earnings compared to 12x for its direct peer group and 11.5x for the wider US Banks industry.
P/E simply compares what investors pay for each dollar of earnings. For a regional bank like First National Bank Alaska, this often reflects what the market thinks about the resilience of profit, balance sheet strength, and how predictable earnings might be over time.
FBAK has some support for that richer P/E tag. Earnings have grown 8% per year over the past 5 years. Its most recent annual earnings growth of 12.7% is ahead of its own 5 year pace, and profit margins of 37.1% are higher than last year’s 36.2%. Management and the board are also described as experienced, with average tenures of 7 years and 8.4 years respectively.
There are counterweights investors may weigh against that premium. Return on equity is 14.3%, which is categorised as low, and the dividend track record is labelled unstable. FBAK’s 1 year total shareholder return exceeded both the US market and the US Banks industry, so part of the P/E premium could also reflect share price momentum already in the rear view mirror rather than fresh fundamentals.
Compared with peers, the wording is clear. FBAK is tagged as expensive versus both its direct peer average P/E of 12x and the broader industry on 11.5x. This suggests investors are currently paying more for the same dollar of bank earnings than the sector baseline.
See what the numbers say about this price — find out in our valuation breakdown.
Result: Price-to-earnings of 12.4x (OVERVALUED)
Still, the story around First National Bank Alaska could be tested if earnings momentum cools or if the higher P/E attracts profit taking after strong past returns.
Find out about the key risks to this First National Bank Alaska narrative.
Another view on First National Bank Alaska’s value
The P/E screen presents First National Bank Alaska as expensive, yet the SWS DCF model suggests the opposite. On that cash flow view, FBAK at $326.60 is identified as trading 28.3% below an estimated value of $455.33 per share. Which signal should carry more weight for you?
Look into how the SWS DCF model arrives at its fair value.
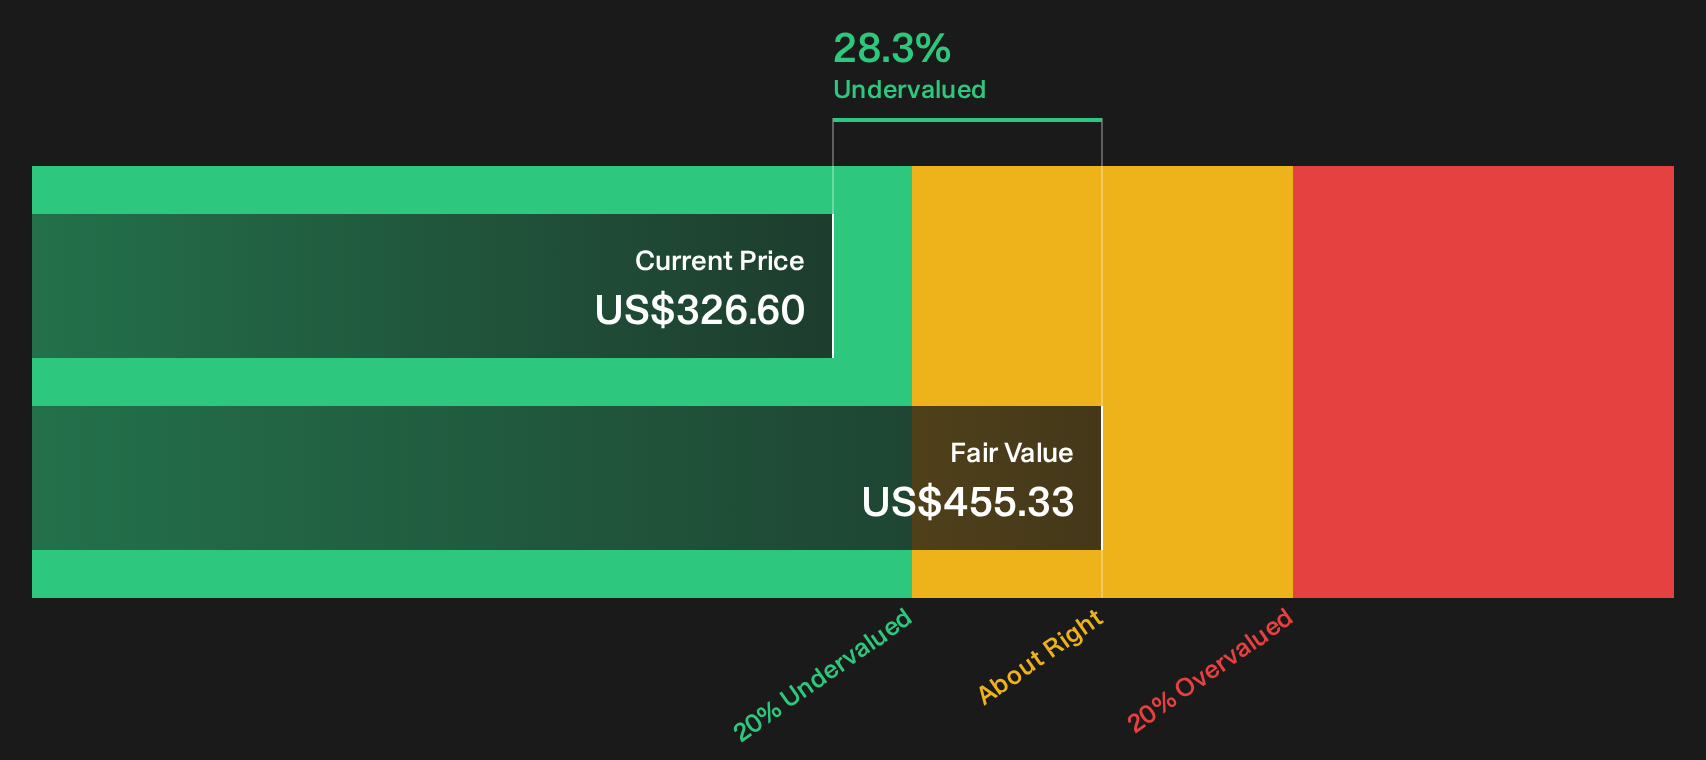
Simply Wall St performs a discounted cash flow (DCF) on every stock in the world every day (check out First National Bank Alaska for example). We show the entire calculation in full. You can track the result in your watchlist or portfolio and be alerted when this changes, or use our stock screener to discover 28 high quality undervalued stocks. If you save a screener we even alert you when new companies match - so you never miss a potential opportunity.
Next Steps
Mixed messages on value and sentiment around First National Bank Alaska can be confusing, so move quickly and test the numbers for yourself instead of relying on headlines. To balance that picture and weigh both sides of the story, start with the 2 key rewards and 1 important warning sign.
Looking for more investment ideas beyond First National Bank Alaska?
If you stop your research with First National Bank Alaska, you could miss other opportunities that fit your risk tolerance, income goals, or value focus.
- Spot potential mispricing early and run your own comparison against a 28 high quality undervalued stocks that filters for quality alongside attractive pricing signals.
- Build a more resilient income stream by scanning a 8 dividend fortresses focused on higher yielding payers with support from underlying fundamentals.
- Strengthen capital protection by using a list of solid balance sheet and fundamentals (25 results) that highlights businesses with cleaner debt profiles and sturdier financial footing.
This article by Simply Wall St is general in nature. We provide commentary based on historical data and analyst forecasts only using an unbiased methodology and our articles are not intended to be financial advice. It does not constitute a recommendation to buy or sell any stock, and does not take account of your objectives, or your financial situation. We aim to bring you long-term focused analysis driven by fundamental data. Note that our analysis may not factor in the latest price-sensitive company announcements or qualitative material. Simply Wall St has no position in any stocks mentioned.
Have feedback on this article? Concerned about the content? Get in touch with us directly. Alternatively, email editorial-team@simplywallst.com