
- PRICING
- LIVE QUOTES
- LEARN
- HELP


EN
General Dynamics (GD), Is There More To Its Latest Update?
General Dynamics (GD) just set up a major leadership handover, with long-time chief Phebe Novakovic moving to executive chairman and current president Danny Deep slated to take the CEO role starting in January 2027.
Recent trading has been softer, with General Dynamics showing a 30 day share price return down 6.1% and a 90 day share price return down 11.7%. However, the 3 year total shareholder return of 44.5% and 5 year total shareholder return of 76.6% point to longer term momentum that investors are weighing alongside the leadership shuffle and the latest cash dividend declaration.
Compare this leadership shift at General Dynamics with other defense and industrial players that have been quietly resetting their own story in our curated list of 31 resilient stocks with low risk scores.
General Dynamics now trades with recent weakness set against solid multi year shareholder gains. Are investors reacting to a real shift in the business or just cooling on the story, and what does the current valuation suggest?
Price-to-Earnings of 19.9x: Is it justified for General Dynamics?
Valuation on General Dynamics currently leans supportive, with the stock at $331.27 trading on a P/E of 19.9x that screens as good value versus both peers and the wider Aerospace & Defense industry.
The P/E ratio compares the share price to earnings per share. For a defense and aerospace contractor like General Dynamics, that gauge shows how much investors are paying today for each dollar of profit coming from its $54.9b in revenue and $4.5b in net income.
General Dynamics is flagged as good value on several fronts. The current P/E of 19.9x sits below the peer average of 28.5x and below the broader US Aerospace & Defense industry average of 35x, suggesting the market is paying a lower price tag for the same unit of earnings compared with many rivals. In addition, the estimated fair P/E of 25x is higher than where the stock trades today, which indicates that the market’s pricing could move closer to that fair ratio if sentiment or earnings expectations change.
Explore the SWS fair ratio for General Dynamics.
Result: Price-to-Earnings of 19.9x (UNDERVALUED)
Still, the General Dynamics story could be knocked off course by weaker defense spending or contract delays that pressure its US-focused revenue mix.
Find out about the key risks to this General Dynamics narrative.
Another view on General Dynamics using cash flows
The first lens on General Dynamics focused on earnings and a P/E of 19.9x that screens as cheap against peers. A second lens using the SWS DCF model points to a fair value of $447.80 per share versus the current $331.27 price, which frames the stock as undervalued. Could the market be underpaying for those future cash flows?
Look into how the SWS DCF model arrives at its fair value.
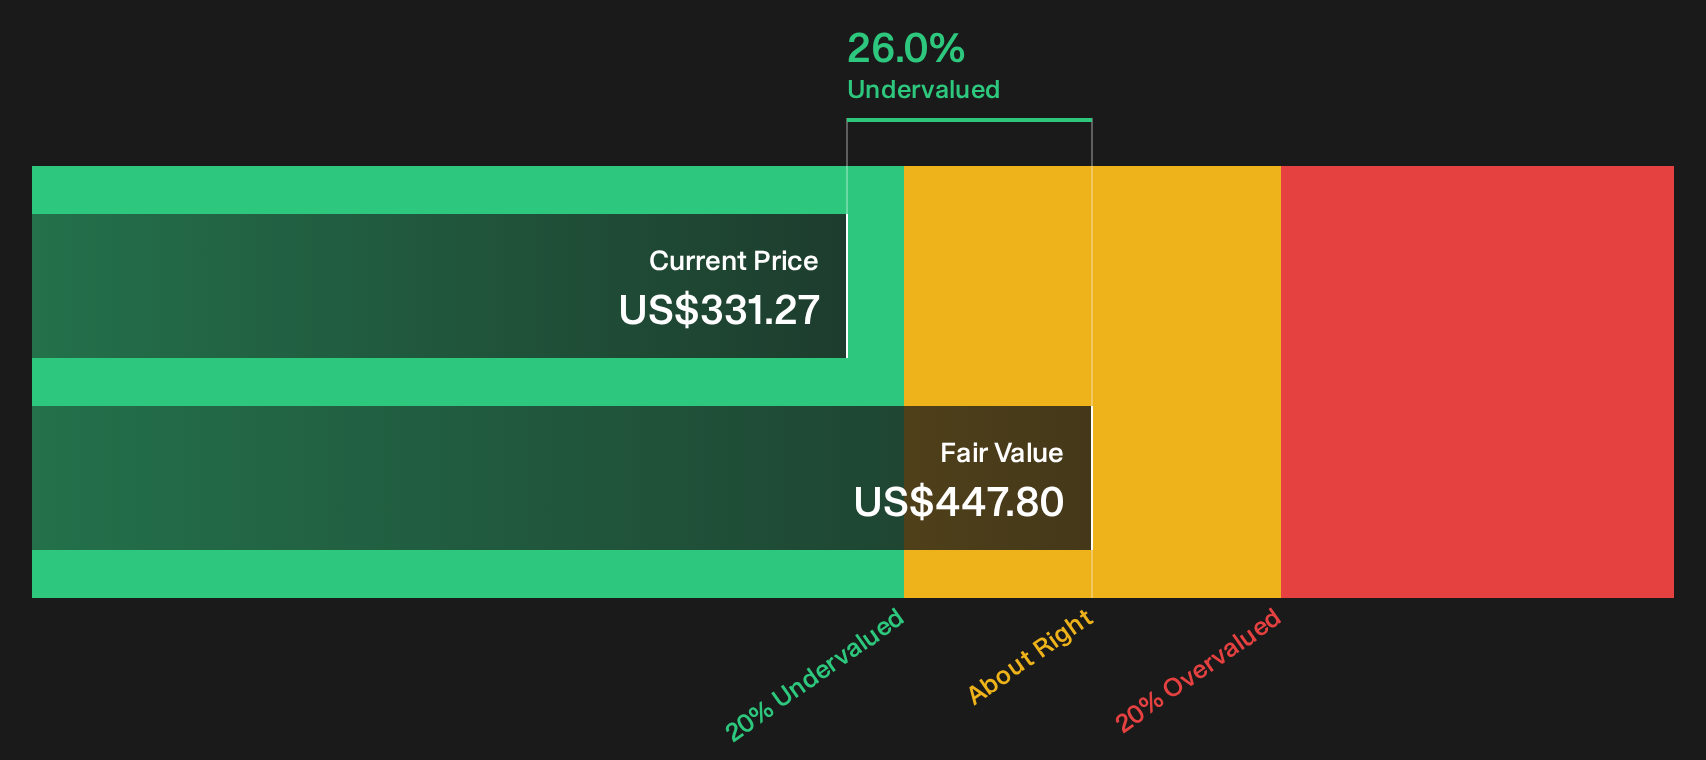
Simply Wall St performs a discounted cash flow (DCF) on every stock in the world every day (check out General Dynamics for example). We show the entire calculation in full. You can track the result in your watchlist or portfolio and be alerted when this changes, or use our stock screener to discover 28 high quality undervalued stocks. If you save a screener we even alert you when new companies match - so you never miss a potential opportunity.
Next Steps
If this mix of leadership change, valuation signals and cash flow estimates around General Dynamics leaves you undecided, move quickly and inspect the underlying numbers yourself. To see why some investors are focusing on potential upsides, start with the 6 key rewards.
Looking for more investment ideas beyond General Dynamics?
Do not park your cash in one story when the market keeps throwing up fresh possibilities. Use the Simply Wall Street Screener to surface ideas that actually fit your goals.
- Target undervalued opportunities by scanning for companies that combine cash flow strength with quality fundamentals through the 28 high quality undervalued stocks.
- Strengthen your income stream by focusing on businesses filtered for resilient, higher yielding payouts using the 8 dividend fortresses.
- Prioritise resilience by zeroing in on companies with sturdy finances and dependable fundamentals in the list of solid balance sheet and fundamentals (25 results).
This article by Simply Wall St is general in nature. We provide commentary based on historical data and analyst forecasts only using an unbiased methodology and our articles are not intended to be financial advice. It does not constitute a recommendation to buy or sell any stock, and does not take account of your objectives, or your financial situation. We aim to bring you long-term focused analysis driven by fundamental data. Note that our analysis may not factor in the latest price-sensitive company announcements or qualitative material. Simply Wall St has no position in any stocks mentioned.
Have feedback on this article? Concerned about the content? Get in touch with us directly. Alternatively, email editorial-team@simplywallst.com