
- PRICING
- LIVE QUOTES
- LEARN
- HELP


EN
Cincinnati Financial (CINF) Could Be 15% Undervalued After Credit Agreement Extension
Cincinnati Financial (CINF) just secured a one year extension on its existing credit agreement, pushing the expiration to October 10, 2031, while keeping all other terms unchanged.
Recent trading tells a mixed story for Cincinnati Financial. The share price has eased around 3% over the past month and about 9% over 90 days, yet the 1-year total shareholder return of roughly 5% and a very strong 3-year total shareholder return above 70% signal that longer term momentum has been much stronger than the recent pullback suggests.
Scan beyond Cincinnati Financial and see how other insurers and financials with healthy balance sheets are trading by checking our curated list of solid balance sheet and fundamentals (25 results) today.
After a sharp 3 month slide, yet with a one year gain still in the green, Cincinnati Financial trades at a clear gap to published value estimates. Is that discount justified or overdone?
Most Popular Narrative: 15% Undervalued
Cincinnati Financial closed at $163.39, while the most widely followed narrative pegs fair value closer to $191.67. This implies a meaningful valuation gap that rests heavily on underwriting discipline and capital strength holding up.
Strong capital generation from underwriting and investments, reflected in a fixed maturity portfolio yield of 5.08% in Q2 2026, new bond purchases yielding 5.66% on average, investment income that rose 12% year on year, and a US$8.6b net appreciated investment position that supports record book value of US$108.64 per share, creates room for future earnings and book value growth.
See why 9 investors see Cincinnati Financial as 15% undervalued.
Result: Fair Value of $191.67 (UNDERVALUED)
Still, this hinges on catastrophe losses and expense ratios not worsening again. Persistent weather hits or sticky costs could quickly undercut that 15% undervalued story.
Find out about the key risks to this Cincinnati Financial narrative.
Another View: Cash Flows Tell A Tougher Story For Cincinnati Financial
The popular narrative paints Cincinnati Financial as roughly 15% undervalued on earnings and book value. A different lens tells a cooler story. Our DCF model, which prices the stock on estimated future cash flows, comes out at about $137.23, below the current $163.39 level. That points to an overvalued signal instead of a bargain and puts the spotlight on how confident you are in those long term cash flow assumptions.
To see how that cash flow view is built and where the pressure points sit, take a look at the Look into how the SWS DCF model arrives at its fair value..
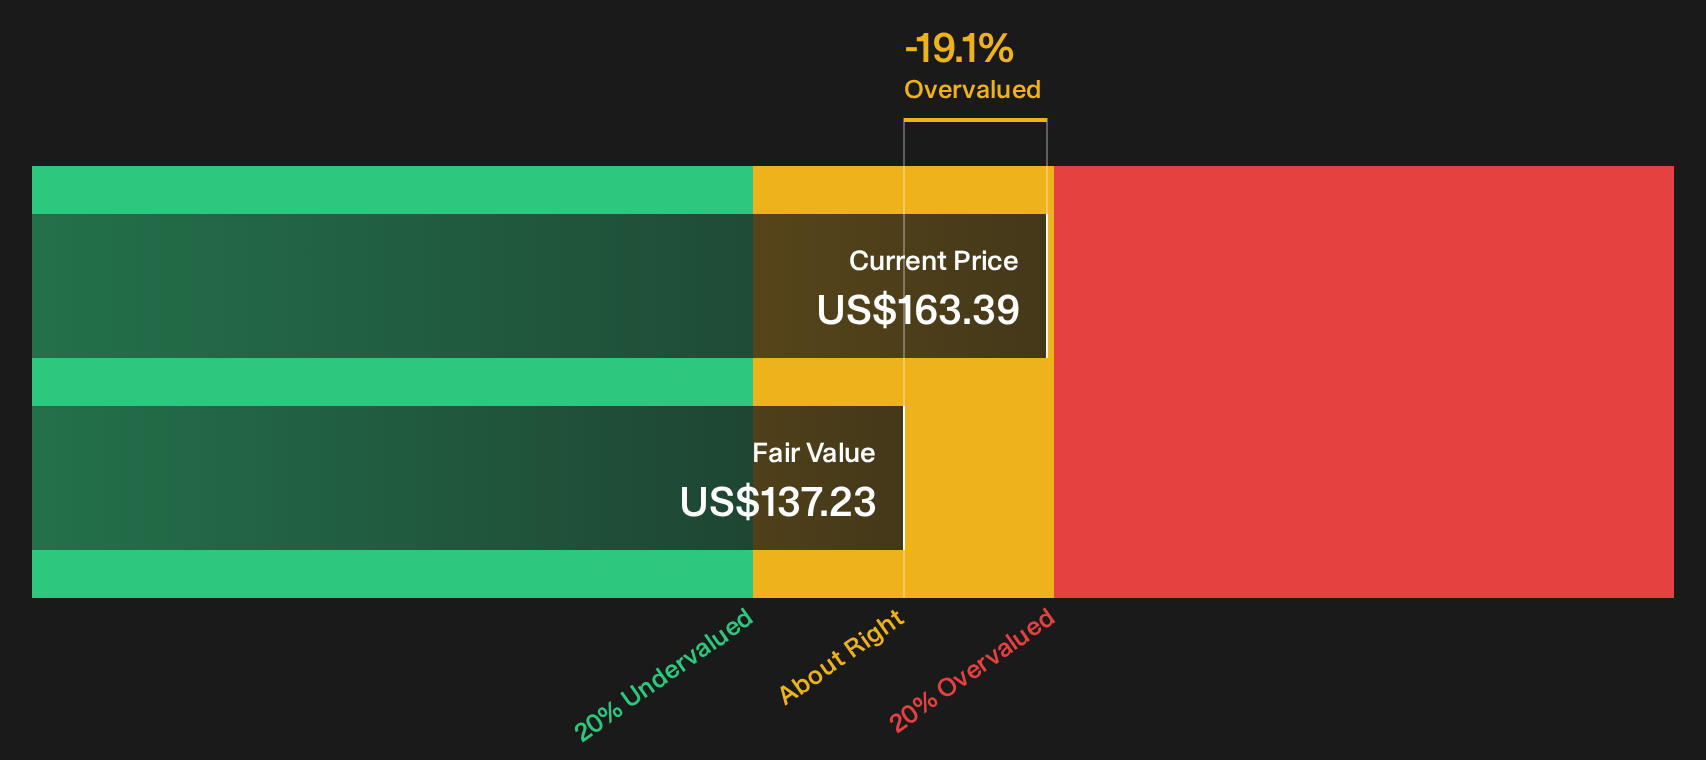
Simply Wall St performs a discounted cash flow (DCF) on every stock in the world every day (check out Cincinnati Financial for example). We show the entire calculation in full. You can track the result in your watchlist or portfolio and be alerted when this changes, or use our stock screener to discover 28 high quality undervalued stocks. If you save a screener we even alert you when new companies match - so you never miss a potential opportunity.
Next Steps
Mixed signals like these around Cincinnati Financial often split opinion, so move quickly, review the data yourself, and weigh both the 3 key rewards and 1 important warning sign.
Looking for more investment ideas beyond Cincinnati Financial?
If Cincinnati Financial has you thinking more broadly about opportunity and risk, use the same tools to quickly surface other focused ideas before the crowd moves on.
- Target resilient compounding potential by scanning a curated 28 high quality undervalued stocks that combines quality fundamentals with what may be mispriced entry points.
- Strengthen your income stream by reviewing a handpicked 8 dividend fortresses built around higher yields with business stability in mind.
- Dial down portfolio stress by focusing on a 31 resilient stocks with low risk scores that screens for financially sturdy companies with lower risk scores.
This article by Simply Wall St is general in nature. We provide commentary based on historical data and analyst forecasts only using an unbiased methodology and our articles are not intended to be financial advice. It does not constitute a recommendation to buy or sell any stock, and does not take account of your objectives, or your financial situation. We aim to bring you long-term focused analysis driven by fundamental data. Note that our analysis may not factor in the latest price-sensitive company announcements or qualitative material. Simply Wall St has no position in any stocks mentioned.
Have feedback on this article? Concerned about the content? Get in touch with us directly. Alternatively, email editorial-team@simplywallst.com