
- PRICING
- LIVE QUOTES
- LEARN
- HELP


EN
Is WorkmanLtd (TSE:7564) Undervalued After Its Recent Share Price Slide?
WorkmanLtd (TSE:7564) drew investor attention after recent trading left the stock down about 11% over the past month and roughly 12% over the past 3 months, increasing focus on its valuation.
Recent moves sit against a tougher backdrop for WorkmanLtd. The share price is down about 22% year to date and the 1 year total shareholder return has declined roughly 8%, while the 3 year total shareholder return of about 26% indicates that longer term momentum has been stronger than the current trend.
Compare how WorkmanLtd stacks up against other potential turnaround plays by reviewing a curated set of 12 high quality undervalued stocks with solid fundamentals and room for sentiment to shift.
After that pullback, either most of the easy money in WorkmanLtd has already been made, or the weaker sentiment has left more upside on the table. The valuation numbers start to answer which scenario you are really looking at.
Preferred P/E of 18.9x: Is it justified for WorkmanLtd?
Valuation on earnings is blunt here. WorkmanLtd trades on a P/E of 18.9x, which looks punchy when the share price is already under pressure.
The P/E ratio compares the current share price to earnings per share. For a retailer like WorkmanLtd, it shows how much investors are paying for each unit of current profitability rather than future hopes alone.
Against that yardstick, the stock is described as expensive versus both its peer group average of 16.1x and the broader JP Specialty Retail industry at 12.8x. The fair P/E estimate sits at 16x, so the gap between the current 18.9x and that level points to a richer valuation multiple than the regression based fair level the market could shift toward.
Explore the SWS fair ratio for WorkmanLtd.
Result: Price-to-Earnings of 18.9x (OVERVALUED)
Still, if WorkmanLtd faces slower franchise demand or pressure on workwear and casual clothing budgets, enthusiasm around a richer P/E could fade quickly.
Find out about the key risks to this WorkmanLtd narrative.
Another View On WorkmanLtd’s Value
The P/E ratio paints WorkmanLtd as expensive, yet our DCF model suggests a different story. At ¥5,230, the stock trades about 22.5% below an estimated future cash flow value of roughly ¥6,751, which implies investors are paying less for the projected stream of cash.
That kind of gap can reflect cautious expectations or simply a lag in sentiment. The real question is whether the cash flows behind that DCF hold up as new data lands.
Look into how the SWS DCF model arrives at its fair value.
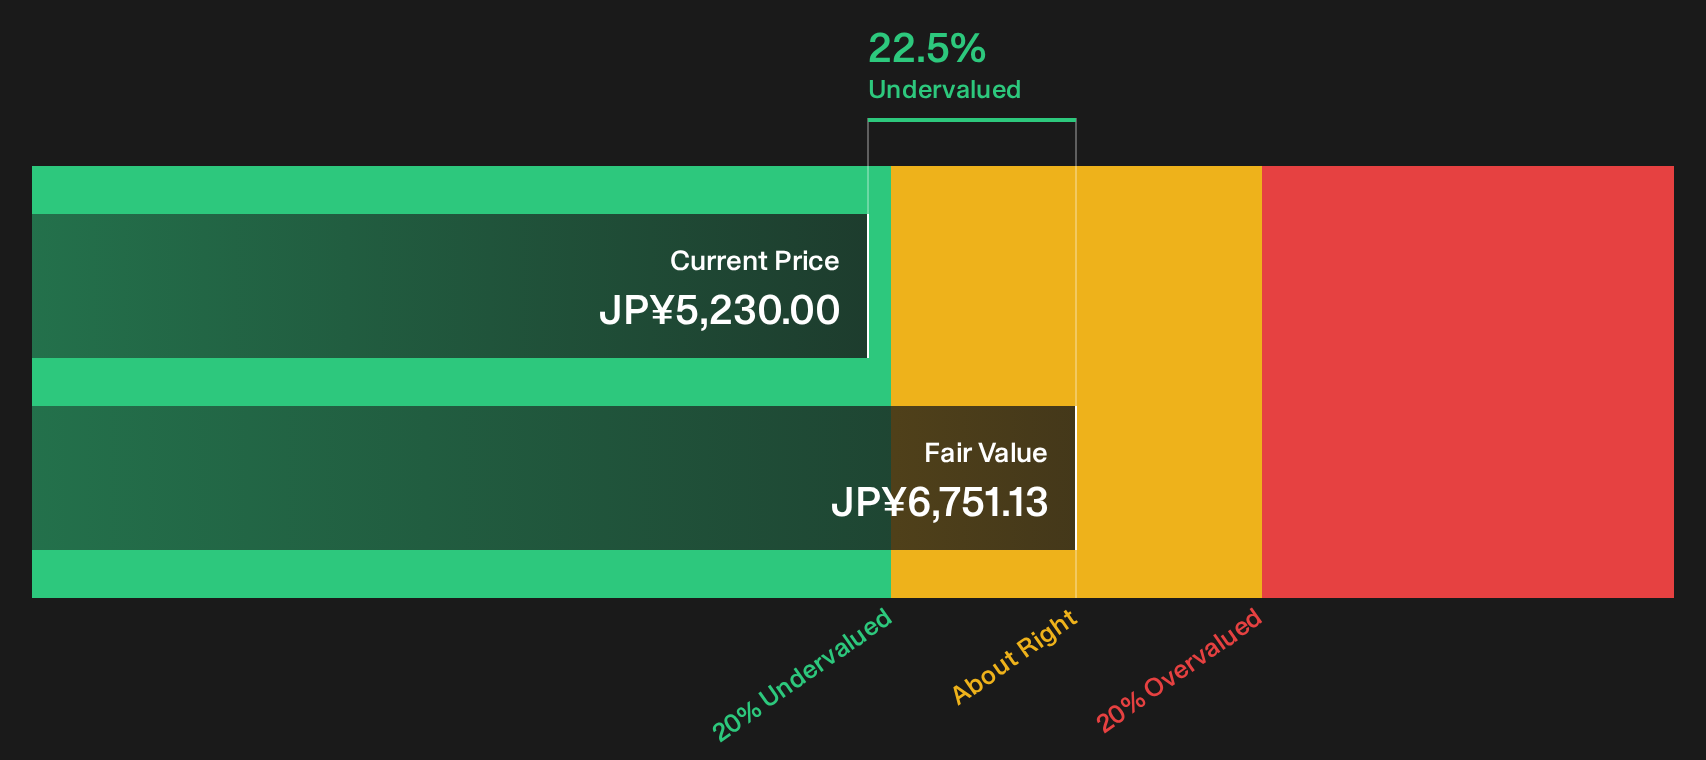
Simply Wall St performs a discounted cash flow (DCF) on every stock in the world every day (check out WorkmanLtd for example). We show the entire calculation in full. You can track the result in your watchlist or portfolio and be alerted when this changes, or use our stock screener to discover 12 high quality undervalued stocks. If you save a screener we even alert you when new companies match - so you never miss a potential opportunity.
Next Steps
Sentiment around WorkmanLtd in this review has been mixed, so treat that as your cue to move quickly and stress test the data yourself. To see why some shareholders are still optimistic, take a closer look at the 3 key rewards.
Looking for more investment ideas beyond WorkmanLtd?
If you are serious about putting fresh capital to work, use the Simply Wall Street Screener to spot opportunities before they move and pressure test your thesis fast.
- Target potential bargain entries by scanning a curated 12 high quality undervalued stocks that already pair solid financial profiles with discounted market pricing.
- Strengthen your defensive side by reviewing a list of solid balance sheet and fundamentals (23 results) that may handle tougher conditions better than more fragile peers.
- Hunt for early-stage potential by checking a focused 1 elite penny stocks with strong financials that filters for quality traits instead of pure speculation.
This article by Simply Wall St is general in nature. We provide commentary based on historical data and analyst forecasts only using an unbiased methodology and our articles are not intended to be financial advice. It does not constitute a recommendation to buy or sell any stock, and does not take account of your objectives, or your financial situation. We aim to bring you long-term focused analysis driven by fundamental data. Note that our analysis may not factor in the latest price-sensitive company announcements or qualitative material. Simply Wall St has no position in any stocks mentioned.
Have feedback on this article? Concerned about the content? Get in touch with us directly. Alternatively, email editorial-team@simplywallst.com