
- PRICING
- LIVE QUOTES
- LEARN
- HELP


EN
MORI TRUST REIT (TSE:8961) Secures A New Core Tenant, Is It Still Below Fair Value?
MORI TRUST REIT (TSE:8961) has secured a new core tenant for about 70% of ON Building’s leasable area after Kobe Steel’s planned exit, with rent per unit set at a higher level.
Despite the new lease helping address earlier vacancy concerns, MORI TRUST REIT’s share price return is still down 15.36% year to date at ¥66,700. A weaker 90 day share price return of 10.83% points to fading short term momentum, while the 5 year total shareholder return of 14.36% shows a more resilient longer term picture.
Scan how MORI TRUST REIT compares with other income-focused real estate plays by reviewing a curated list of 28 dividend fortresses in similar yield territory.
The ON Building lease win sits against a share price that has fallen this year. Is MORI TRUST REIT now being priced on business fundamentals or on fading sentiment that has run ahead of the facts?
Preferred P/E Multiple of 18.1x: Is it justified?
MORI TRUST REIT trades on a P/E of 18.1x while the last close sits at ¥66,700, and that valuation sits above both peer and broader Asian REIT averages.
The P/E multiple shows how much investors are currently willing to pay for each unit of earnings. For income oriented real estate vehicles like MORI TRUST REIT, it often reflects how investors weigh the reliability of rental income, the outlook for distributions, and the stability of occupancy rather than fast growth.
The trust reports high quality earnings and has grown profits by 9.5% per year over the past 5 years. At the same time, earnings declined over the past year, margins narrowed from 59.5% to 56.5%, and analysts expect profits to edge down by an average of 0.3% per year over the next 3 years, which can make an above peer P/E look demanding.
Relative to the Asian REITs industry average P/E of 15.3x and the peer average of 16.2x, the 18.1x multiple is clearly richer. The fair P/E estimate of 19.4x suggests the market price to earnings level could move closer to that fair ratio if sentiment or fundamentals line up with that implied value.
Explore the SWS fair ratio for MORI TRUST REIT.
Result: Price-to-earnings of 18.1x (OVERVALUED).
Still, any pressure on occupancy beyond the current 99.8% rate or weaker income trends from its Japan focused portfolio could quickly challenge the case for MORI TRUST REIT’s richer P/E.
Find out about the key risks to this MORI TRUST REIT narrative.
Another View: MORI TRUST REIT Through The SWS DCF Lens
The income statement points to a rich P/E for MORI TRUST REIT, yet the SWS DCF model values its future cash flows at about ¥92,783 per unit versus a ¥66,700 market price. That indicates a 28.1% discount. Could investors be overlooking the cash flow story behind this REIT?
Look into how the SWS DCF model arrives at its fair value.
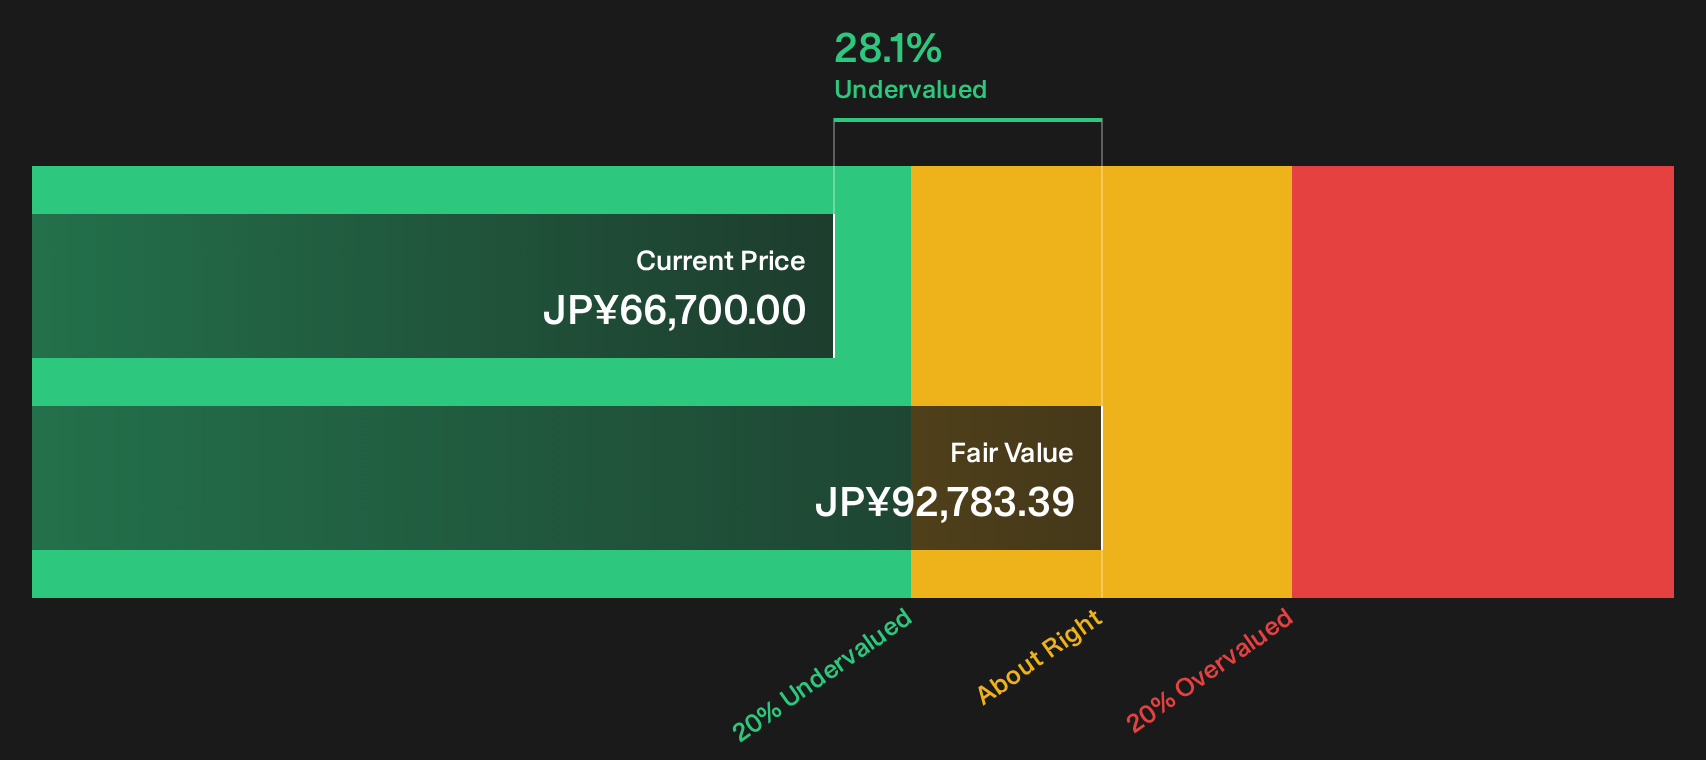
Simply Wall St performs a discounted cash flow (DCF) on every stock in the world every day (check out MORI TRUST REIT for example). We show the entire calculation in full. You can track the result in your watchlist or portfolio and be alerted when this changes, or use our stock screener to discover 12 high quality undervalued stocks. If you save a screener we even alert you when new companies match - so you never miss a potential opportunity.
Next Steps
Mixed signals around MORI TRUST REIT can make the story feel muddled, so move quickly to review the underlying data and weigh both the upside and the weak spots for yourself with the 1 key reward and 3 important warning signs
Looking for more MORI TRUST REIT sized ideas?
If MORI TRUST REIT has prompted fresh questions about value, income and resilience, use this moment to refresh your watchlist before the next move passes you by.
- Target higher quality at lower prices by running through a 12 high quality undervalued stocks that filters for stronger businesses trading at discounted valuations.
- Prioritise stability in rough markets by scanning a 23 resilient stocks with low risk scores focused on companies with more resilient profiles and fewer red flags.
- Hunt for tomorrow's potential standouts by checking a 74 high quality undiscovered gems built to surface underfollowed stocks with solid fundamentals.
This article by Simply Wall St is general in nature. We provide commentary based on historical data and analyst forecasts only using an unbiased methodology and our articles are not intended to be financial advice. It does not constitute a recommendation to buy or sell any stock, and does not take account of your objectives, or your financial situation. We aim to bring you long-term focused analysis driven by fundamental data. Note that our analysis may not factor in the latest price-sensitive company announcements or qualitative material. Simply Wall St has no position in any stocks mentioned.
Have feedback on this article? Concerned about the content? Get in touch with us directly. Alternatively, email editorial-team@simplywallst.com