
- PRICING
- LIVE QUOTES
- LEARN
- HELP


EN
Cmb.Tech (ENXTBR:CMBT) After Its Ammonia Ship Debut And Dividend Approval Looks Fully Valued
Why Cmb.Tech’s Latest Dividend And Green Shipping Push Matter
Cmb.Tech (ENXTBR:CMBT) has just paired a fresh clean shipping milestone with a new cash return. The Mineral Europa ammonia-fuelled vessel has started sailing as shareholders signed off on a US$0.64 per share distribution.
Recent trading has leaned in Cmb.Tech’s favour, with the share price at €18.68 and a 90-day share price return of 39.2% alongside a year-to-date share price gain of 131.76%. That rising trend sits next to a 1-year total shareholder return of 151.86%, which suggests that the decarbonisation story and fresh cash distribution are both contributing to stronger momentum rather than fading enthusiasm.
Scan other shipping and energy-transition plays that pair cash returns with decarbonisation stories by checking our hand picked list of 222 resilient stocks with low risk scores.
Bulls see Cmb.Tech as a rare mix of green shipping story and hefty cash return, while bears point to falling annual revenue and net income. Which side do the current valuation signals support next?
Most Popular Narrative: 18% Overvalued
The most followed narrative puts Cmb.Tech’s fair value at €15.85 using a 7.18% discount rate, compared with the latest close at €18.68. That gap frames the current rally as richer than the narrative’s central case and sets the tone for how much future cash generation needs to do the heavy lifting.
Post-merger scale from Golden Zhoushan, funded CapEx and active refinancing of higher cost bridges and leases create room for lower average funding costs, higher operating leverage and greater capacity for dividends or buybacks once the balance sheet converges toward the targeted 50 percent loan to value, enhancing earnings per share.
See why 8 investors see Cmb.Tech as 18% overvalued.
Result: Fair Value of €15.85 (OVERVALUED)
Still, the heavy tilt toward spot shipping markets and the risk that ammonia or hydrogen adoption moves slower than hoped could quickly challenge the bullish Cmb.Tech story.
Find out about the key risks to this Cmb.Tech narrative.
Another View On Cmb.Tech’s Valuation
The narrative crowd sees Cmb.Tech as 18% overpriced at €18.68 versus a €15.85 fair value, yet the SWS DCF model points the other way and flags the shares as trading about 41% below an estimated future cash flow value of €31.68. Which lens do you trust more when cash flows and sentiment disagree?
Look into how the SWS DCF model arrives at its fair value.
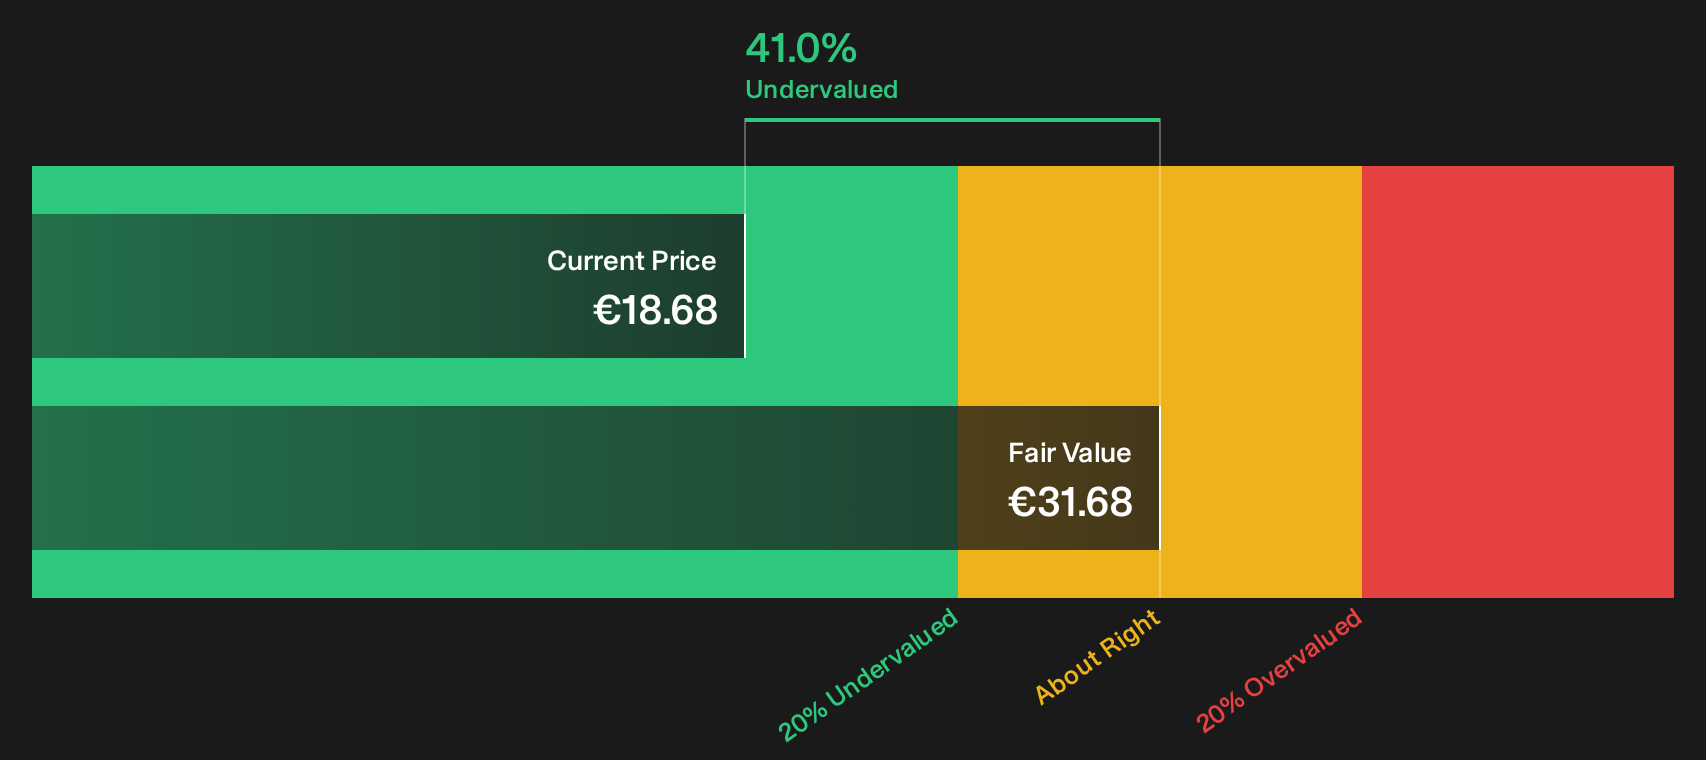
Simply Wall St performs a discounted cash flow (DCF) on every stock in the world every day (check out Cmb.Tech for example). We show the entire calculation in full. You can track the result in your watchlist or portfolio and be alerted when this changes, or use our stock screener to discover 174 high quality undervalued stocks. If you save a screener we even alert you when new companies match - so you never miss a potential opportunity.
Next Steps
The story of Cmb.Tech so far presents mixed signals. If you want to move quickly and form your own view, start by weighing the 2 key rewards and 3 important warning signs.
Looking For More Ideas Beyond Cmb.Tech?
If Cmb.Tech has sharpened your focus on fresh opportunities, do not stop here. Build a wider watchlist and let the numbers guide your next move.
- Target potential mispricing by scanning companies that appear beaten down yet financially sound through our 174 high quality undervalued stocks.
- Strengthen your income stream by reviewing businesses that currently offer robust payouts inside the 223 dividend fortresses.
- Reduce portfolio stress by filtering for sturdier balance sheets and durable fundamentals using the list of solid balance sheet and fundamentals (204 results).
This article by Simply Wall St is general in nature. We provide commentary based on historical data and analyst forecasts only using an unbiased methodology and our articles are not intended to be financial advice. It does not constitute a recommendation to buy or sell any stock, and does not take account of your objectives, or your financial situation. We aim to bring you long-term focused analysis driven by fundamental data. Note that our analysis may not factor in the latest price-sensitive company announcements or qualitative material. Simply Wall St has no position in any stocks mentioned.
Have feedback on this article? Concerned about the content? Get in touch with us directly. Alternatively, email editorial-team@simplywallst.com