
- PRICING
- LIVE QUOTES
- LEARN
- HELP


EN
Spartan Delta (TSX:SDE) Looks Fully Priced On Earnings Beat And Higher Guidance
Spartan Delta (TSX:SDE) has moved back into focus after its latest earnings release beat quarterly expectations and came with higher annual operational guidance, giving investors fresh data on production plans and capital discipline.
Spartan Delta’s share price has been on a strong run, with a 7 day share price return of 12.22% and a 90 day share price return of 23.62%. The 1 year total shareholder return of 145.92% and 5 year total shareholder return of about 7x point to powerful momentum that recent guidance upgrades and earnings beats have helped reinforce against a premium valuation debate.
Compare Spartan Delta’s premium priced momentum with other energy stocks by scanning our hand picked 7 high quality undervalued stocks that pair solid balance sheets with meaningful cash flow support.
After a move like this and a P/E multiple well above the Canadian oil and gas pack, Spartan Delta now poses a sharper question. Does the upgraded guidance still leave enough upside to justify that premium risk?
Preferred P/E of 40.4x: Is it justified?
On a simple snapshot, Spartan Delta trades on a P/E of 40.4x against a last close of CA$13.87, a level that screens as expensive when lined up next to both its Canadian oil and gas peers and the broader local market.
P/E compares the current share price to earnings per share and effectively shows how many dollars investors are paying today for each dollar of current profit. For a cyclical producer in Western Canada, that metric often acts as a shorthand for how confident the market is in the durability of cash flows through commodity swings.
Here, the picture is mixed. Earnings have declined by 27.4% per year over the past 5 years, yet the most recent year saw a 90% rebound and net profit margins at 13.8% compared with 12.6% a year earlier. Revenue is also forecast to grow 41.5% per year, although there is insufficient data to say whether profits are expected to rise at a similar pace or to exceed the Canadian market in the years ahead.
The comparison with peers is sharp. SDE is described as expensive on a P/E of 40.4x versus both the Canadian oil and gas industry average of 20.1x and a peer group average of 20.2x. That premium suggests the market is paying roughly double the sector and peer multiples for each dollar of current earnings, based on the information available today.
See what the numbers say about this price — find out in our valuation breakdown.
Result: Price-to-earnings of 40.4x (OVERVALUED).
Still, the narrative can unwind quickly if Spartan Delta’s premium earnings multiple collides with weaker commodity pricing, or if execution slips on its Western Canada projects.
Find out about the key risks to this Spartan Delta narrative.
Another view on Spartan Delta’s value
The SWS DCF model paints a very different picture for Spartan Delta. On this view, the estimated future cash flow value is CA$2.75 per share, while the market price sits at CA$13.87. That gap points to a stock our DCF model flags as overvalued rather than just fully priced.
For investors, this clash between an earnings based multiple that looks rich and a cash flow model that comes in far lower raises a practical question. Is the market correctly baking in a much stronger future, or is sentiment simply running ahead of the underlying cash generation story?
Look into how the SWS DCF model arrives at its fair value.
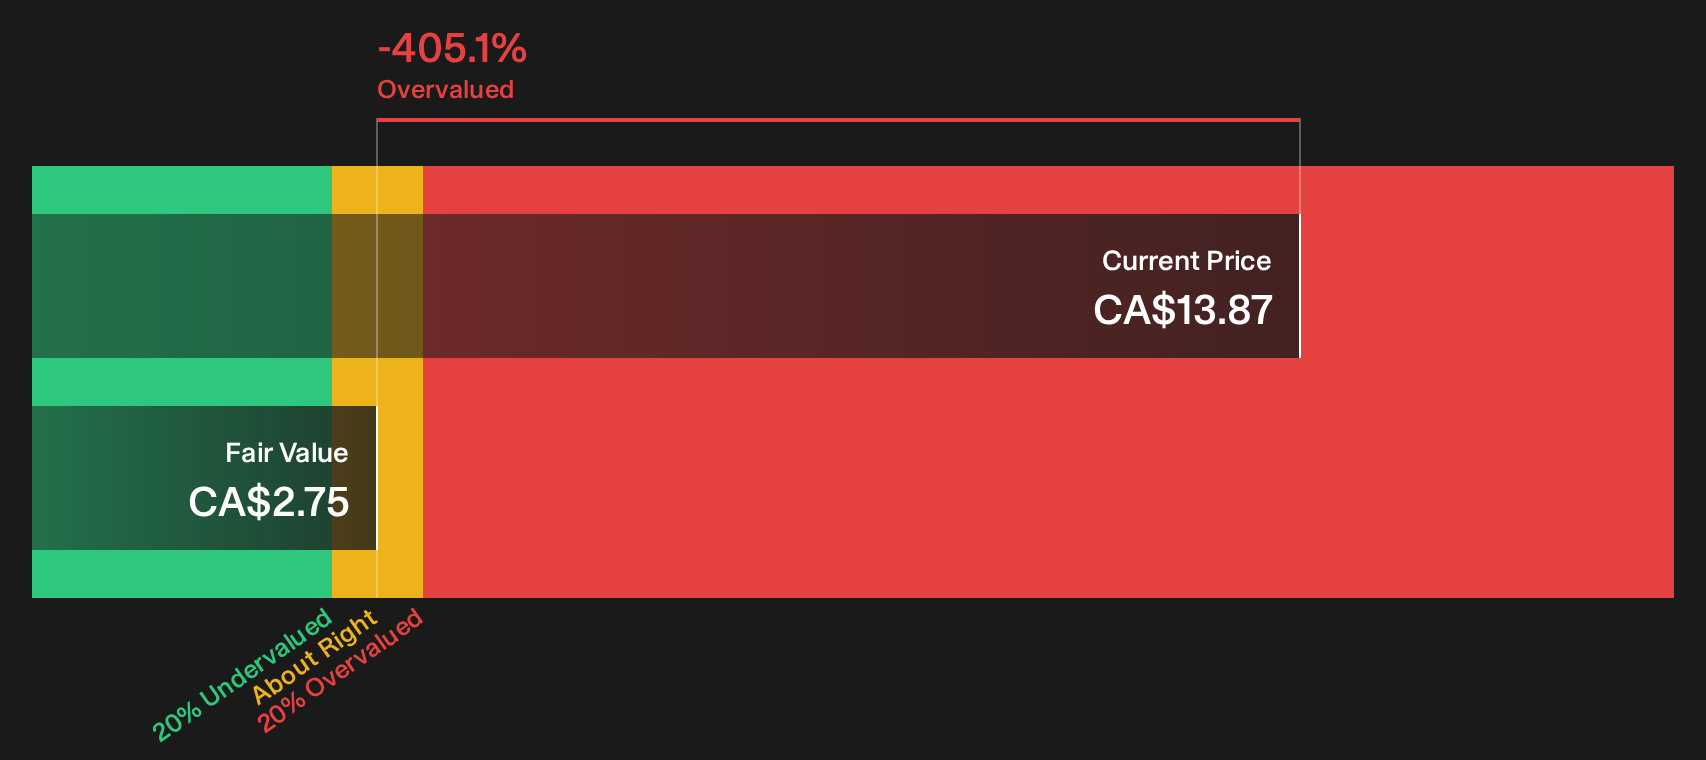
Simply Wall St performs a discounted cash flow (DCF) on every stock in the world every day (check out Spartan Delta for example). We show the entire calculation in full. You can track the result in your watchlist or portfolio and be alerted when this changes, or use our stock screener to discover 7 high quality undervalued stocks. If you save a screener we even alert you when new companies match - so you never miss a potential opportunity.
Next Steps
If this mix of strong recent returns and a rich multiple leaves you split, move quickly to stress test both sides of the story and decide where you land. To see how that balance of concerns and potential upsides stacks up, review the 2 key rewards and 3 important warning signs.
Looking for more Spartan Delta sized opportunities?
If Spartan Delta has sharpened your focus, do not stop here. Broaden your watchlist with fresh ideas other investors may overlook.
- Target value with resilience by scanning a curated 7 high quality undervalued stocks that combines quality fundamentals with prices that may leave more room on the table.
- Prioritise staying power and sleep-at-night capital by checking a 8 resilient stocks with low risk scores built around steadier balance sheets and lower overall risk scores.
- Hunt for future standouts early by reviewing a 9 high quality undiscovered gems packed with under-followed businesses that still show strong underlying fundamentals.
This article by Simply Wall St is general in nature. We provide commentary based on historical data and analyst forecasts only using an unbiased methodology and our articles are not intended to be financial advice. It does not constitute a recommendation to buy or sell any stock, and does not take account of your objectives, or your financial situation. We aim to bring you long-term focused analysis driven by fundamental data. Note that our analysis may not factor in the latest price-sensitive company announcements or qualitative material. Simply Wall St has no position in any stocks mentioned.
Have feedback on this article? Concerned about the content? Get in touch with us directly. Alternatively, email editorial-team@simplywallst.com