
- PRICING
- LIVE QUOTES
- LEARN
- HELP


EN
Corn Cracks, Bears Attack
Walsh Pure Grain Technicals / Daily News – Pure Hedge Division
Tim Healy 10/9/2026
If you would like to receive more information on the commodity markets or would like to open an account, please give me a call.
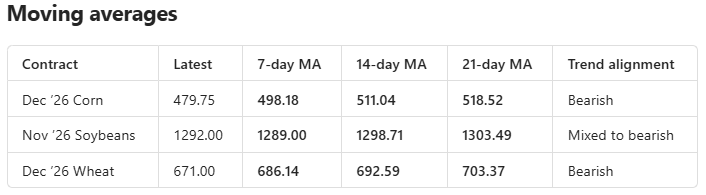
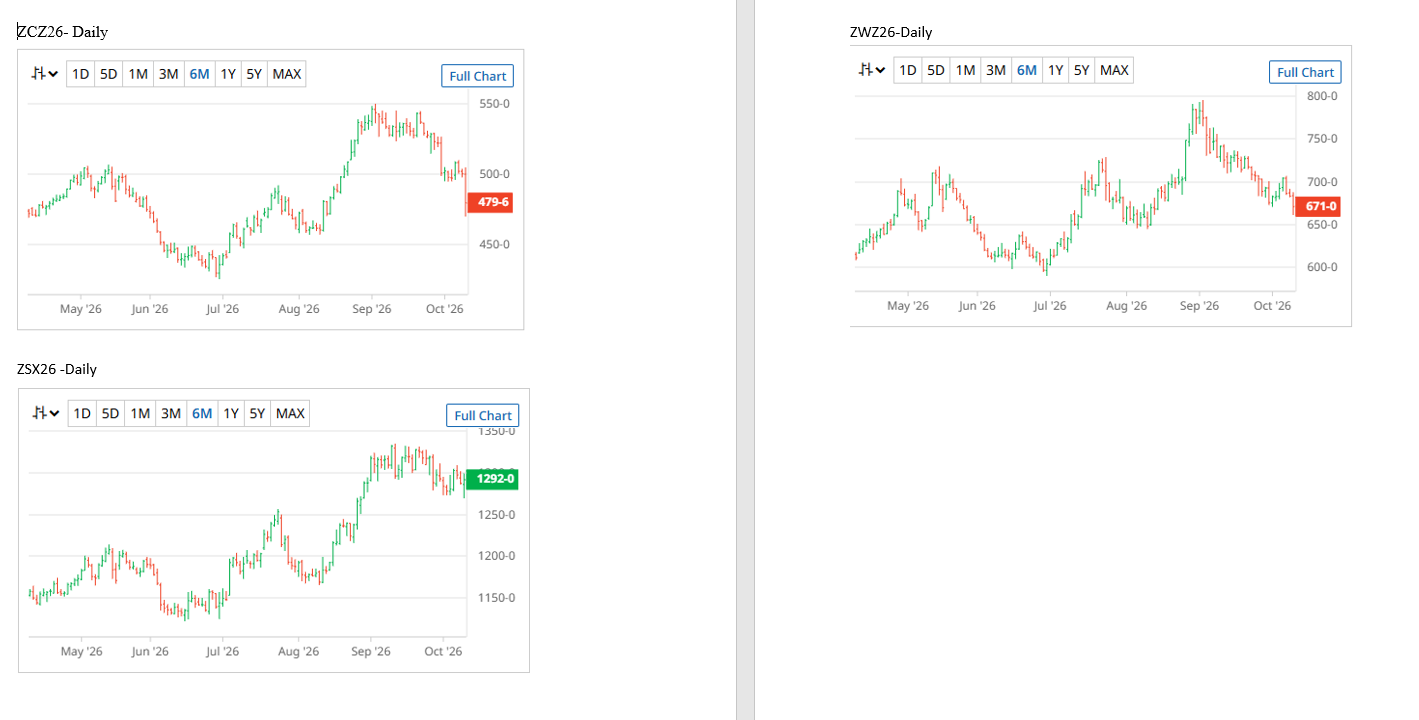
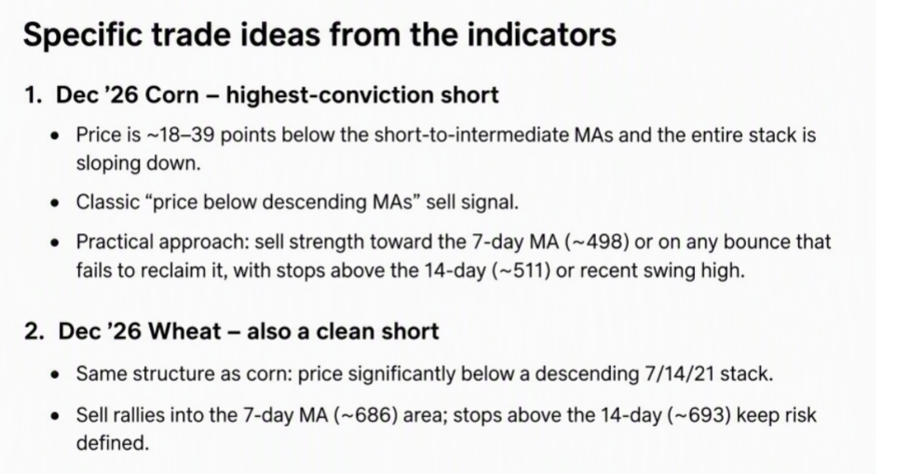
Corn: strong bearish momentum
Alignment: Latest price < 7-day < 14-day < 21-day
- Corn at 479.75 is 18+ cents below its 7-day average.
- The 7-day average is below the 14-day, and the 14-day is below the 21-day. That is a fully bearish moving-average stack.
- The October 9 decline to 479.75 accelerated the existing downtrend. Price is now approximately 38.77 cents below the 21-day average.
- Corn is the weakest of the three markets based on both moving-average alignment and distance below the short-term average.
- The first indication of stabilization would be a recovery above roughly 498 to 502. A stronger reversal signal would require a move above the 511 to 519 moving-average zone.
Technical reading: Bearish, with downside momentum accelerating. Avoid treating the market as technically recovered solely because of a one-day bounce.
Soybeans: consolidation within a softer trend
Alignment: 7-day MA < latest price < 14-day MA < 21-day MA
- Soybeans at 1292.00 are 3 cents above the 7-day average.
- However, price remains 6.71 cents below the 14-day and 11.49 cents below the 21-day.
- The 7-day average remains below both longer averages, so the broader short-term structure has not turned bullish.
- Unlike corn and wheat, soybeans are holding near their short-term average. This indicates consolidation rather than an accelerating decline.
- A close above approximately 1299 to 1304 would improve the setup materially by reclaiming the 14-day and 21-day averages.
- A break back below approximately 1284 to 1289 would reinforce the bearish trend and put the recent lows back in focus.
Technical reading: Neutral to slightly bearish. Soybeans have the strongest relative setup of the three because current price is above the 7-day average, but they still need to reclaim the longer averages.
Wheat: bearish trend
Alignment: Latest price < 7-day < 14-day < 21-day
- Wheat at 671.00 is 15+ cents below its 7-day average.
- The 7-day average is below the 14-day, and the 14-day is below the 21-day, confirming a bearish trend structure.
- Price is approximately 32+ cents below the 21-day average.
- The progression from 703.37 to 692.59 to 686.14 shows that shorter-term prices are progressively weaker than the longer lookback periods.
- Wheat would first need to recover the 683 to 686 area to stabilize. The more important reversal zone is approximately 693 to 703.
Technical reading: Bearish. The setup is not as sharply extended as corn, but the moving-average alignment remains decisively negative.

Tim Healy
Broker
Pure Hedge Division
Direct: 1 312 957 4731
WALSH TRADING INC.
311 S. Wacker Suite 540
Chicago, Illinois 60606
Walsh Trading, Inc. is registered as a Guaranteed Introducing Broker with the Commodity Futures Trading Commission and an NFA Member.
Futures and options trading involves substantial risk and is not suitable for all investors. Therefore, individuals should carefully consider their financial condition in deciding whether to trade. Option traders should be aware that the exercise of a long option will result in a futures position. The valuation of futures and options may fluctuate, and as a result, clients may lose
more than their original investment. The information contained on this site is the opinion of the writer or was obtained from sources cited within the commentary. The impact on market prices due to seasonal or market cycles and current news events may already be reflected in market prices. PAST PERFORMANCE IS NOT NECESSARILY INDICATIVE OF FUTURE RESULTS.
All information, communications, publications, and reports, including this specific material, used and distributed by Walsh Trading, Inc. (“WTI”) shall be construed as a solicitation for entering into a derivatives transaction. WTI does not distribute research reports, employ research analysts, or maintain a research department as defined in CFTC Regulation 1.71.