
- PRICING
- LIVE QUOTES
- LEARN
- HELP


EN
Revenue Beat Could Be A Game Changer For Old Second Bancorp Stock (OSBC)
- Old Second Bancorp reported Q2 revenue of $96.91 million, up 28.4% year on year and about 2% above analyst expectations, while earnings per share matched consensus.
- The strong top line outcome highlights how Old Second Bancorp’s higher yielding lending mix and fee streams are feeding into revenue, even though profit per share did not move ahead of forecasts.
- We will now examine how Old Second Bancorp’s stronger than expected Q2 revenue shapes its existing investment narrative around earnings power.
Scan how Old Second Bancorp’s Q2 surprise lines up against peers by reviewing hand picked 27 high quality undervalued stocks that pair solid fundamentals with mispriced expectations.
Old Second Bancorp Investment Narrative Recap
To own Old Second Bancorp, you need to be comfortable with a bank that leans into higher yielding specialty and powersports lending while trying to keep credit losses in check. The Q2 revenue beat supports the idea that this model can still produce solid top line results, even as net interest income growth expectations slow and deposit competition remains significant.
The key near term factor remains how credit costs trend from here, particularly around commercial real estate and powersports loans. If net charge offs linger at elevated levels, that could chip away at earnings quality. The Q2 result does not remove that risk, but it also does not appear to worsen it in a material way.
The most relevant development alongside this quarter is the ongoing focus on an asset sensitive balance sheet and tax equivalent net interest margin above 5%, supported by total deposit costs around 1.00%. The Q2 revenue outcome shows Old Second Bancorp is still relying on that spread driven engine, with specialty and powersports portfolios feeding into higher yielding assets.
This same mix links directly back to both the main catalyst and the main risk. Higher APR specialty and powersports loans and fee streams help support resilience in net interest income and overall revenue. At the same time, those portfolios require tight credit discipline. Elevated net charge offs or further stress in office related commercial real estate would quickly test how durable this model is over the next few quarters.
Old Second Bancorp Analyst Expectations In Context
Old Second Bancorp sits in front of a fairly specific analyst script. Revenue is assumed to rise by about 1.5% per year over the next three years, with profit margins moving from 27.1% today to 38.8% in that same period. Earnings are projected to reach US$138.4 million by around 2029 compared with US$92.4 million today, with earnings per share of US$2.65 on those figures.
The jump from US$92.4 million in earnings today to US$138.4 million represents an increase of about US$46 million on analyst numbers. That path also assumes the share count shrinks by roughly 3.41% a year over the next three years, which would help earnings per share even if profit growth is modest. The Q2 revenue beat fits into this story as one more data point that aligns with a gradual revenue trend rather than a rapid reset higher or lower.
On valuation, the analyst framework points to Old Second Bancorp trading on a P/E multiple of 11.4x by 2029, based on the projected US$138.4 million in earnings. That multiple would be lower than the current 13.6x and roughly in line with the present US banks sector P/E of 11.4x. The discount rate used in the Simply Wall St model is 7.24%, while the scenario that ties revenue, earnings and valuation together in the consensus view references a similar 7.2% cost of equity when discounting back to today.
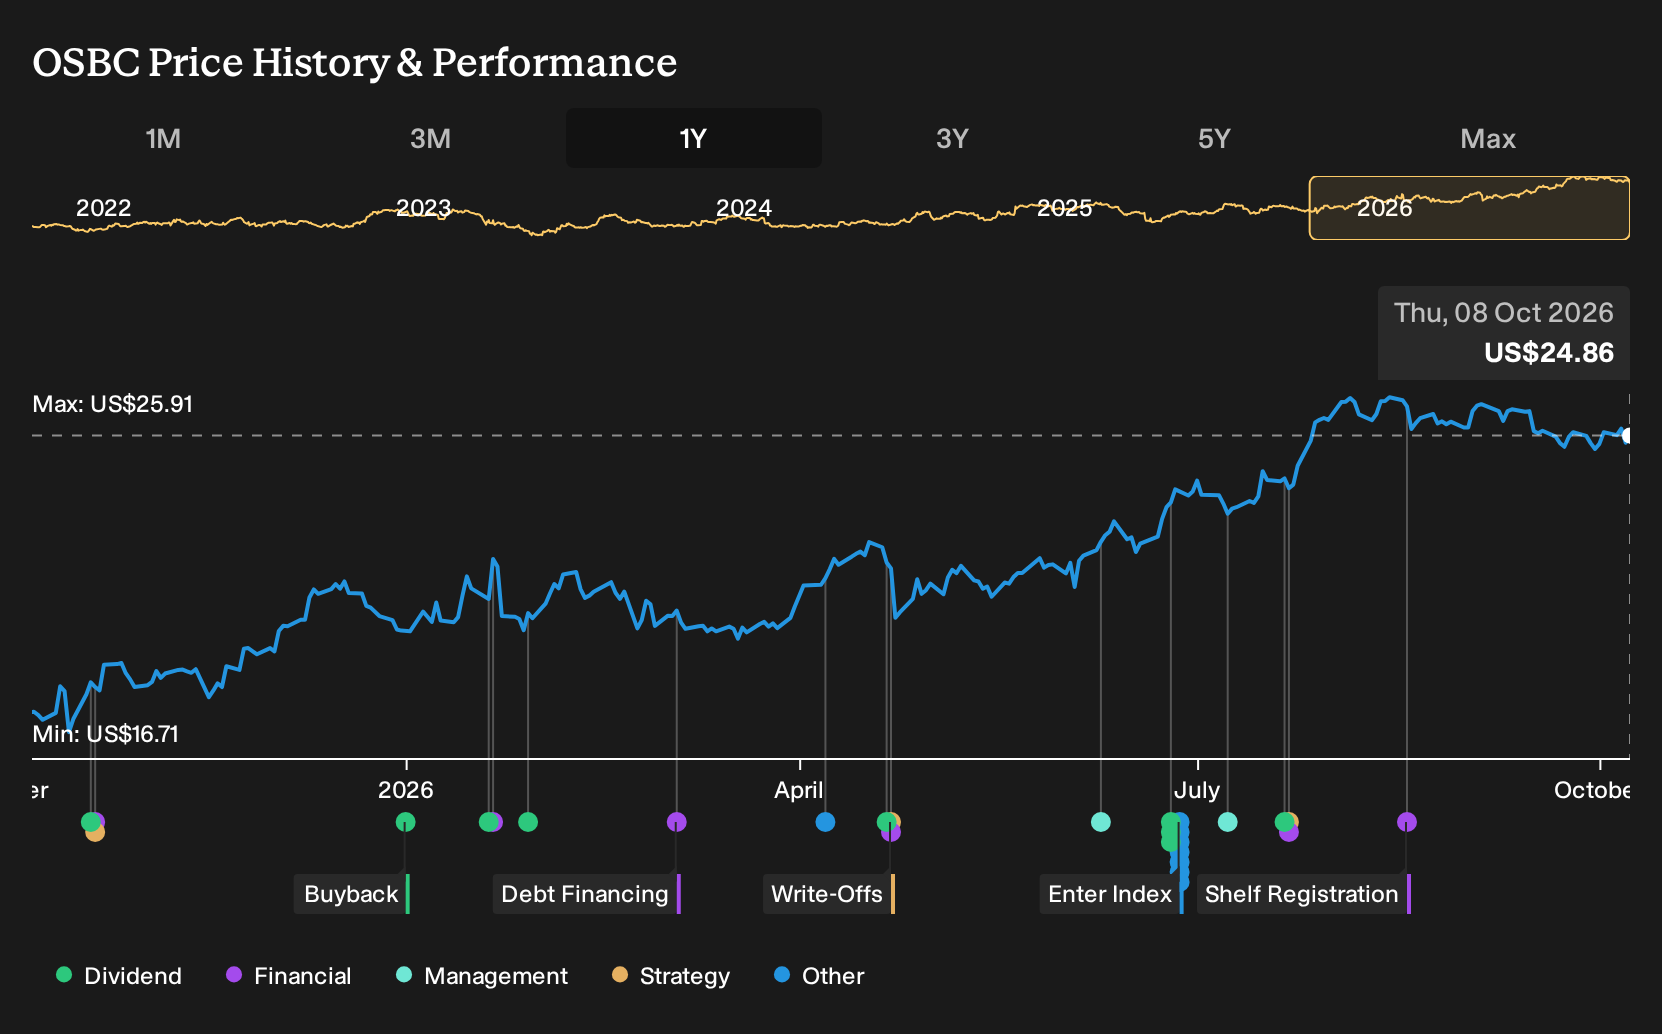
Price targets cluster in a relatively tight range. The consensus sits at US$28.0 per share, with the most optimistic analyst at US$30.0 and the most cautious at US$25.0. Against a recent share price of US$24.66 as of early October 2026, that central target is about 11.9% higher. Those numbers imply that much of the perceived opportunity rests on Old Second Bancorp hitting the forecast margin expansion and earnings trajectory rather than on a sharp rerating of the earnings multiple.
Old Second Bancorp's narrative projects US$357.0 million revenue and US$138.4 million earnings by 2029, based on analyst estimates. This requires 1.5% yearly revenue growth and an earnings increase of about US$46.0 million from US$92.4 million today.
Uncover why Old Second Bancorp's fair value indicates a 13% potential upside to its current price, which could narrow quickly.
Form Your Own Verdict
Disagree with existing narratives? Extraordinary investment returns rarely come from following the herd, so consider forming your own view.
- A great starting point for your Old Second Bancorp research is our analysis highlighting 3 key rewards and 1 important warning sign that could impact your investment decision.
- See our latest analysis for Old Second Bancorp. The report includes a comprehensive fundamental analysis summarized in a single visual, the Snowflake, which makes it easy to evaluate Old Second Bancorp's overall financial health at a glance.
Looking For More Investment Ideas Beyond Old Second Bancorp?
If Old Second Bancorp has sharpened your interest in banks with specific earnings stories, it can help to compare it with other opportunities that have different risk and return profiles using the Simply Wall St Screener.
- For investors who want income at the center of their thesis, scan a curated set of high yield opportunities through 8 dividend fortresses where payouts do more of the heavy lifting.
- If capital preservation sits higher on your list, compare Old Second Bancorp with 31 resilient stocks with low risk scores which combine more modest risk scores with resilient fundamentals.
- When you want to focus on financial strength, stress test your watchlist against a list of solid balance sheet and fundamentals (25 results) that may better handle tougher conditions.
This article by Simply Wall St is general in nature. We provide commentary based on historical data and analyst forecasts only using an unbiased methodology and our articles are not intended to be financial advice. It does not constitute a recommendation to buy or sell any stock, and does not take account of your objectives, or your financial situation. We aim to bring you long-term focused analysis driven by fundamental data. Note that our analysis may not factor in the latest price-sensitive company announcements or qualitative material. Simply Wall St has no position in any stocks mentioned.
Have feedback on this article? Concerned about the content? Get in touch with us directly. Alternatively, email editorial-team@simplywallst.com