
- PRICING
- LIVE QUOTES
- LEARN
- HELP


EN
CNA Financial (CNA) Could Be 45% Undervalued Following Its Recent Pullback
CNA Financial (CNA) drew fresh attention after its recent trading session, with the stock closing at US$46.69. Short term moves contrast with a mixed pattern over the past month and the past 3 months.
Recent trading has been a mixed bag for CNA Financial, with the 1-day share price return of 1.81% and 7-day gain of 1.77% offset by a 90-day share price decline of 8.99%. At the same time, the 1-year total shareholder return of 9.94% and 3-year total shareholder return of 49.12% point to momentum that has built over a longer horizon as investors reassess both growth potential and risk in the stock.
Scan beyond CNA Financial and line up other insurance and financial stocks showing a mix of recent pullbacks and longer term strength with the curated 31 resilient stocks with low risk scores.
CNA Financial has pulled back over the quarter while still sitting below both analyst targets and some intrinsic value estimates. This raises the question of how wide that gap is and what it may indicate about where fair value might actually lie.
Price-to-Earnings of 10.2x: Is it justified?
CNA Financial currently changes hands at a P/E of 10.2x, with the recent close at $46.69 sitting after a quarter of share price pressure but a longer record of total return strength.
The P/E ratio compares the stock price to its earnings per share. For an insurer like CNA Financial, this measure gives you a quick read on how much investors are paying for each dollar of profit, which is often more useful than revenue based metrics in this sector.
Based on the available data, CNA Financial is described as trading at good value versus peers and the wider insurance group. Earnings have grown 41% over the past year, net income sits at $1,237m on revenue of $15,151m, and the SWS DCF model suggests the share price is below an estimated future cash flow value of $85.21. That mix points to a market that is not aggressively pricing in recent profit momentum.
The gap to peers is clear. CNA Financial trades at a P/E of 10.2x compared with a peer average of 14.9x and a US insurance industry average of 10.6x. The ratio is also below an estimated fair P/E of 10.6x, a level the market could move toward if sentiment fully reflects current earnings power.
Explore the SWS fair ratio for CNA Financial.
Result: Price-to-Earnings of 10.2x (UNDERVALUED)
Still, the insurance cycle and CNA Financial's exposure to long term care run off and investment market swings could shift earnings power and challenge that valuation gap.
Find out about the key risks to this CNA Financial narrative.
Another View: What The SWS DCF Model Says
The first lens on CNA Financial focused on its P/E of 10.2x and the gap to peers. A second check uses the SWS DCF model, which pegs future cash flow value at $85.21 per share compared with the current $46.69 price, indicating an undervalued stock within that framework. If two different tools both point to a discount, how comfortable are you with the assumptions behind each one?
Look into how the SWS DCF model arrives at its fair value.
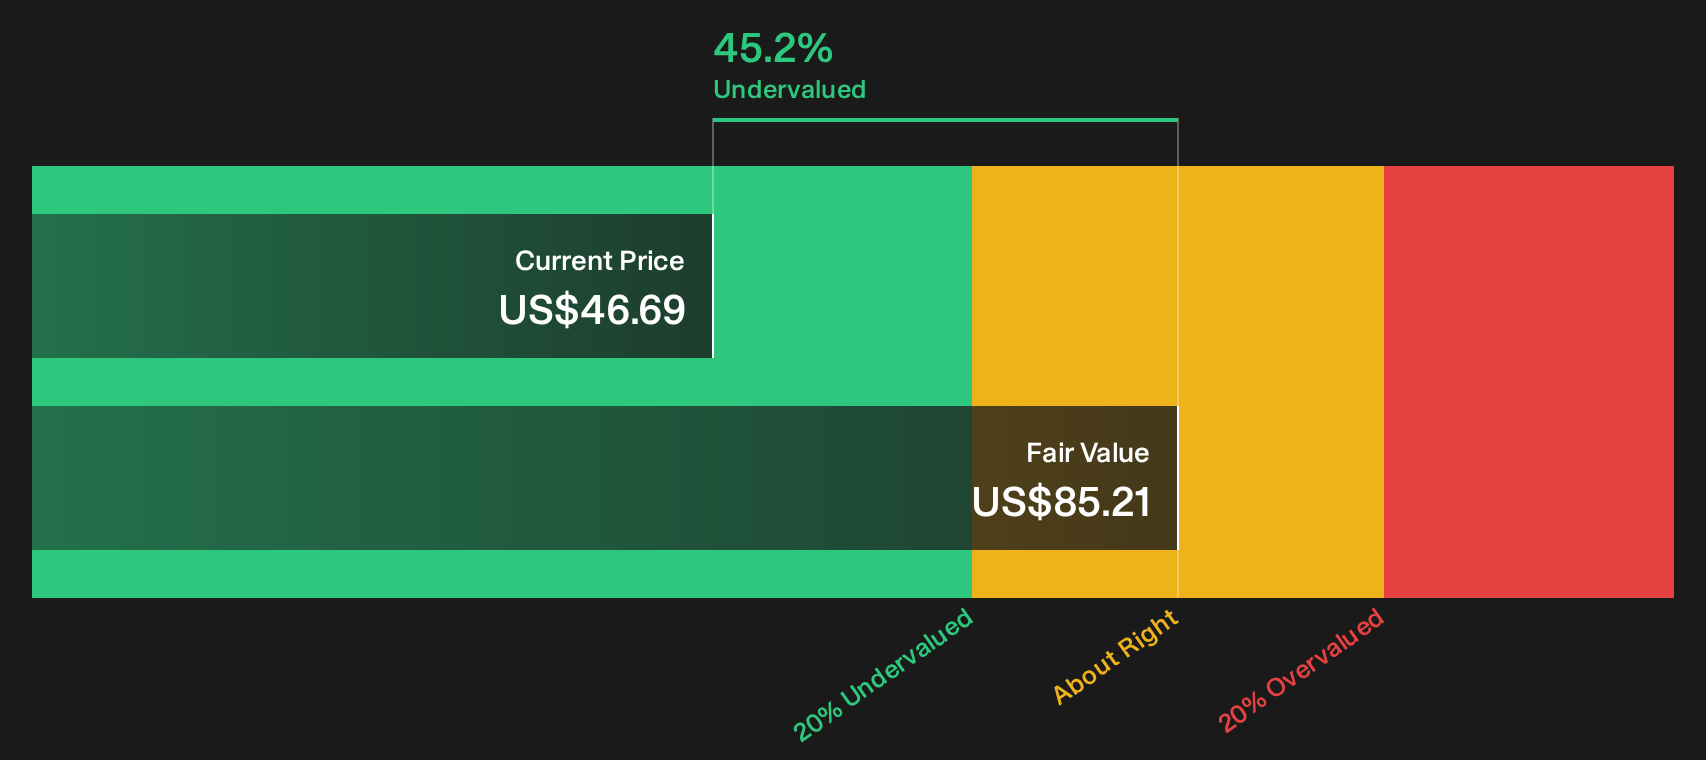
Simply Wall St performs a discounted cash flow (DCF) on every stock in the world every day (check out CNA Financial for example). We show the entire calculation in full. You can track the result in your watchlist or portfolio and be alerted when this changes, or use our stock screener to discover 27 high quality undervalued stocks. If you save a screener we even alert you when new companies match - so you never miss a potential opportunity.
Next Steps
If that mix of signals around CNA Financial feels balanced between promise and concern, move quickly to conduct your own research and pressure test the story against the 4 key rewards and 2 important warning signs.
Looking for more investment ideas beyond CNA Financial?
Do not stop with one ticker. Broaden your watchlist with tools that surface different kinds of opportunities before the crowd focuses on them.
- Target rock solid financial foundations by scanning the list of solid balance sheet and fundamentals (25 results) that filter for balance sheets built to handle tougher conditions.
- Hunt for potential mispricings by working through the 27 high quality undervalued stocks that highlight companies where fundamentals and current prices look out of sync.
- Spot under the radar opportunities early by checking the 20 high quality undiscovered gems that focus on quality businesses getting limited attention today.
This article by Simply Wall St is general in nature. We provide commentary based on historical data and analyst forecasts only using an unbiased methodology and our articles are not intended to be financial advice. It does not constitute a recommendation to buy or sell any stock, and does not take account of your objectives, or your financial situation. We aim to bring you long-term focused analysis driven by fundamental data. Note that our analysis may not factor in the latest price-sensitive company announcements or qualitative material. Simply Wall St has no position in any stocks mentioned.
Have feedback on this article? Concerned about the content? Get in touch with us directly. Alternatively, email editorial-team@simplywallst.com