
- PRICING
- LIVE QUOTES
- LEARN
- HELP


EN
Aozora Bank (TSE:8304) Just Gave Investors Something To Think About
Aozora Bank (TSE:8304) shares closed at ¥3,285 on the latest trading day, leaving investors weighing a recent pullback over the month against a stronger gain over the past 3 months.
Recent trading has cooled after a strong run, with the 7 day share price return down 3.07% and the 30 day share price return down 2.17%. However, Aozora Bank still shows a 12.98% 90 day share price gain and a 50.28% 1 year total shareholder return, suggesting earlier momentum is now easing as investors reassess both growth potential and risk.
Compare Aozora Bank's recent swing with other banks and financials that screen well on quality and value by scanning the hand picked 12 high quality undervalued stocks right after this move.
After a sharp year long climb and a recent pause, Aozora Bank now trades within touching distance of analyst targets yet still screens at a sizeable intrinsic discount. So where does a fair value line realistically fall in that spread?
Preferred P/E of 14.7x: Is it justified?
Aozora Bank screens on valuation as a bank stock where the P/E story and the discounted cash flow view are both on the table. The latest close at ¥3,285 compares with an intrinsic value estimate of ¥4,268.11 from the SWS DCF model, a sizeable gap that investors will likely weigh alongside the current earnings multiple.
The preferred lens here is the P/E ratio. At 14.7x, the shares change hands at a level that sits just below the estimated fair P/E of 14.8x and also below the 20.7x peer average. A P/E simply tells you how much the market is paying for each unit of earnings today, which matters for a lender like Aozora Bank, where earnings quality, credit costs, and balance sheet risk all feed into that price tag.
Quality signals support that earnings anchor. The business is flagged as having high quality earnings and current net profit margins of 21.9% compare with 16.8% a year earlier. Profit growth over the past year of 60.2% also exceeds the banks industry at 41.5%, even though the 5-year earnings trend declined 16.8% per year and return on equity of 6.3% is described as low.
Relative pricing adds another layer. Aozora Bank trades at a P/E of 14.7x against a JP Banks industry average of 15.6x, which is evidence the stock is priced more conservatively than many peers despite recent profit growth. Compared with the estimated fair P/E of 14.8x, the current multiple is very close to a level the market could move towards if conditions and earnings expectations remain consistent with that fair ratio assessment.
Explore the SWS fair ratio for Aozora Bank.
Result: Preferred multiple of price-to-earnings of 14.7x (UNDERVALUED)
Still, the recent share price pullback and relatively low return on equity of 6.3% leave room for sentiment to shift if profitability or asset quality disappoints.
Find out about the key risks to this Aozora Bank narrative.
Another view on Aozora Bank's value
There is a catch. The SWS DCF model points to an intrinsic value of ¥4,268.11 per share, which is about 23% above Aozora Bank's latest close at ¥3,285. That keeps the stock in undervalued territory on a cash flow lens. The key question is how much weight that gap should really carry for you.
Look into how the SWS DCF model arrives at its fair value.
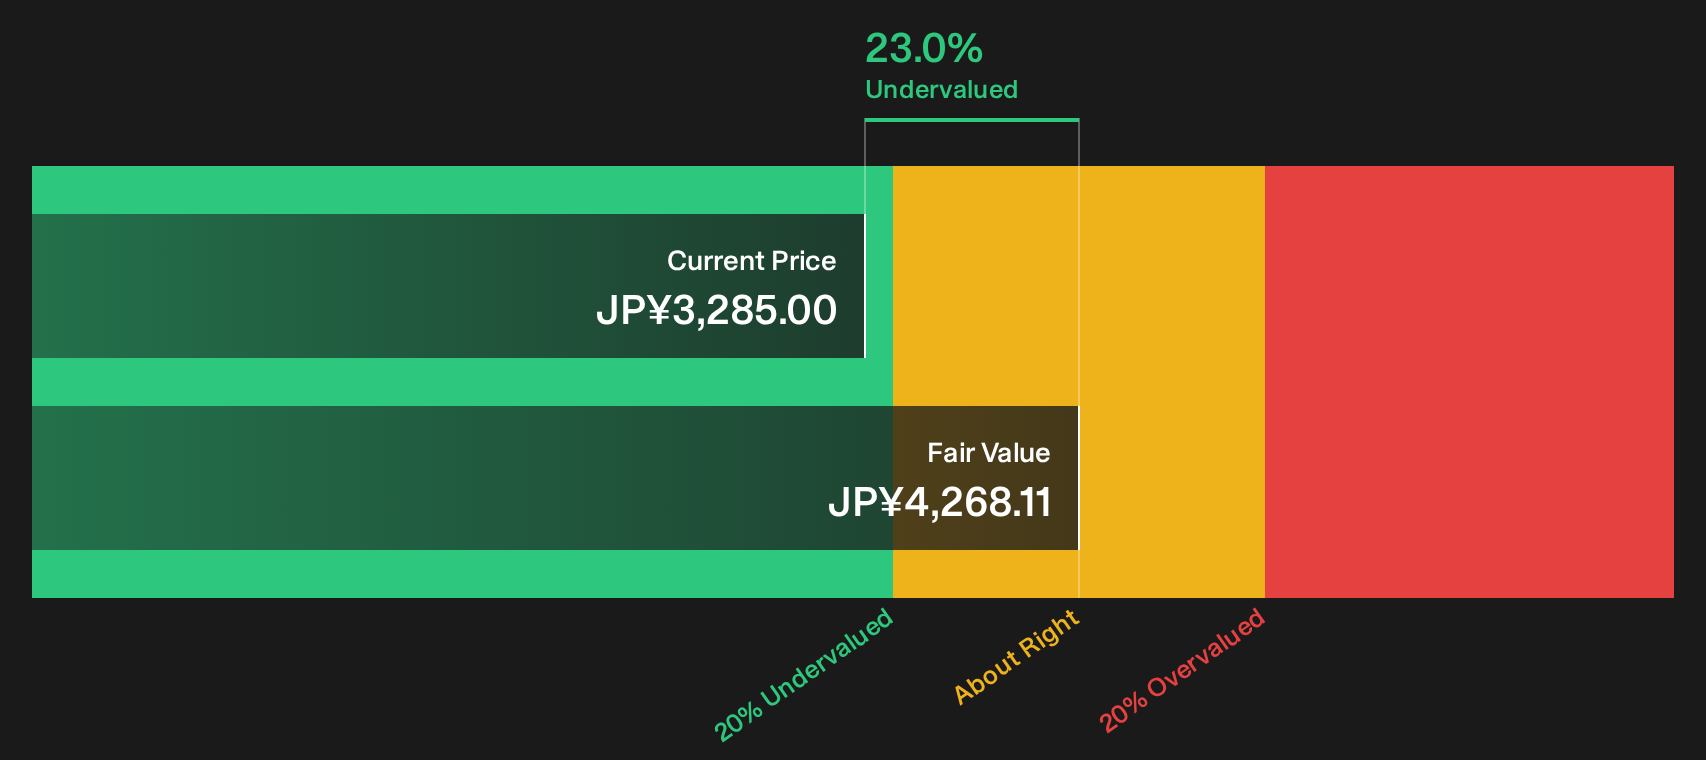
Simply Wall St performs a discounted cash flow (DCF) on every stock in the world every day (check out Aozora Bank for example). We show the entire calculation in full. You can track the result in your watchlist or portfolio and be alerted when this changes, or use our stock screener to discover 12 high quality undervalued stocks. If you save a screener we even alert you when new companies match - so you never miss a potential opportunity.
Next Steps
Conflicted by Aozora Bank's mix of strong recent returns and flagged concerns? Act while sentiment is still forming and review the full picture yourself with the 4 key rewards and 1 important warning sign.
Looking for more investment ideas beyond Aozora Bank?
If Aozora Bank has you thinking harder about price, quality, and risk, it is a good moment to widen your watchlist with fresh, data led ideas.
- Hunt for potential mispriced opportunities that combine solid fundamentals with appealing valuations by checking the 74 high quality undiscovered gems.
- Strengthen the defensive side of your portfolio by filtering for companies on the list of solid balance sheet and fundamentals (23 results) before the crowd catches on.
- Dial down volatility and focus on resilience by reviewing the 23 resilient stocks with low risk scores that could help steady overall returns.
This article by Simply Wall St is general in nature. We provide commentary based on historical data and analyst forecasts only using an unbiased methodology and our articles are not intended to be financial advice. It does not constitute a recommendation to buy or sell any stock, and does not take account of your objectives, or your financial situation. We aim to bring you long-term focused analysis driven by fundamental data. Note that our analysis may not factor in the latest price-sensitive company announcements or qualitative material. Simply Wall St has no position in any stocks mentioned.
Have feedback on this article? Concerned about the content? Get in touch with us directly. Alternatively, email editorial-team@simplywallst.com