
- PRICING
- LIVE QUOTES
- LEARN
- HELP


EN
Kelt Exploration (TSX:KEL) Gains On Drilling Success, Is It Fully Priced?
Kelt Exploration (TSX:KEL) has returned to traders’ screens after a recent share move related to successful drilling, stronger realized pricing, improved well performance, and expanded processing infrastructure in Canadian gas plays.
Recent trading backs up that story, with a 7-day share price return of 7.53% and a 90-day move of 18.05% pointing to firm near term momentum as Kelt Exploration responds to drilling success and a more supportive energy backdrop.
Scan the momentum in Kelt Exploration’s backyard and compare it with other Canadian energy producers on our hand picked list of solid balance sheet and fundamentals (7 results).
Kelt Exploration now has operational momentum and a share price that reflects it. The real tension for investors is whether that recent strength already captures the value on offer or still leaves room on the table.
Price-to-Earnings of 39.1x: Is it justified?
At recent prices, Kelt Exploration trades on a P/E of 39.1x, which puts a rich tag on the CA$10.99 share price compared with many peers.
P/E compares what investors currently pay for each dollar of earnings with the profits the business generates. For an exploration and production player like Kelt Exploration, a higher ratio usually reflects the market paying up for expected growth or viewing its asset base and execution as relatively attractive.
That optimism sits beside mixed signals. Revenue growth is forecast at 25.2% per year, yet profit margins are reported at 9.8%, down from 16.7% last year, and Return on Equity is described as low at 4.8%. With earnings growth over the past year in decline, a P/E of 39.1x suggests traders are paying a premium relative to the company’s recent profitability profile.
The premium becomes clearer when compared with the Canadian Oil and Gas industry, where the average P/E is 20.1x, and with the peer group average of 23.8x. In both cases, Kelt Exploration is described as expensive, which implies the market is assigning a meaningfully higher valuation multiple than is typical across its sector and direct competitors.
See what the numbers say about this price — find out in our valuation breakdown.
Result: Price-to-Earnings of 39.1x (OVERVALUED).
Still, Kelt Exploration faces familiar pressure points, including commodity price swings and any setback in drilling or processing performance that could challenge the current valuation story.
Find out about the key risks to this Kelt Exploration narrative.
Another View on Kelt Exploration’s Valuation
The rich 39.1x P/E ratio paints Kelt Exploration as expensive, and the SWS DCF model points in the same direction. On that framework, the share price of CA$10.99 sits above an estimated future cash flow value of CA$6.33, which implies limited margin for error if conditions soften.
For anyone weighing which lens to trust when the signals line up this way, it helps to see exactly how the cash flow assumptions stack up in detail Look into how the SWS DCF model arrives at its fair value.
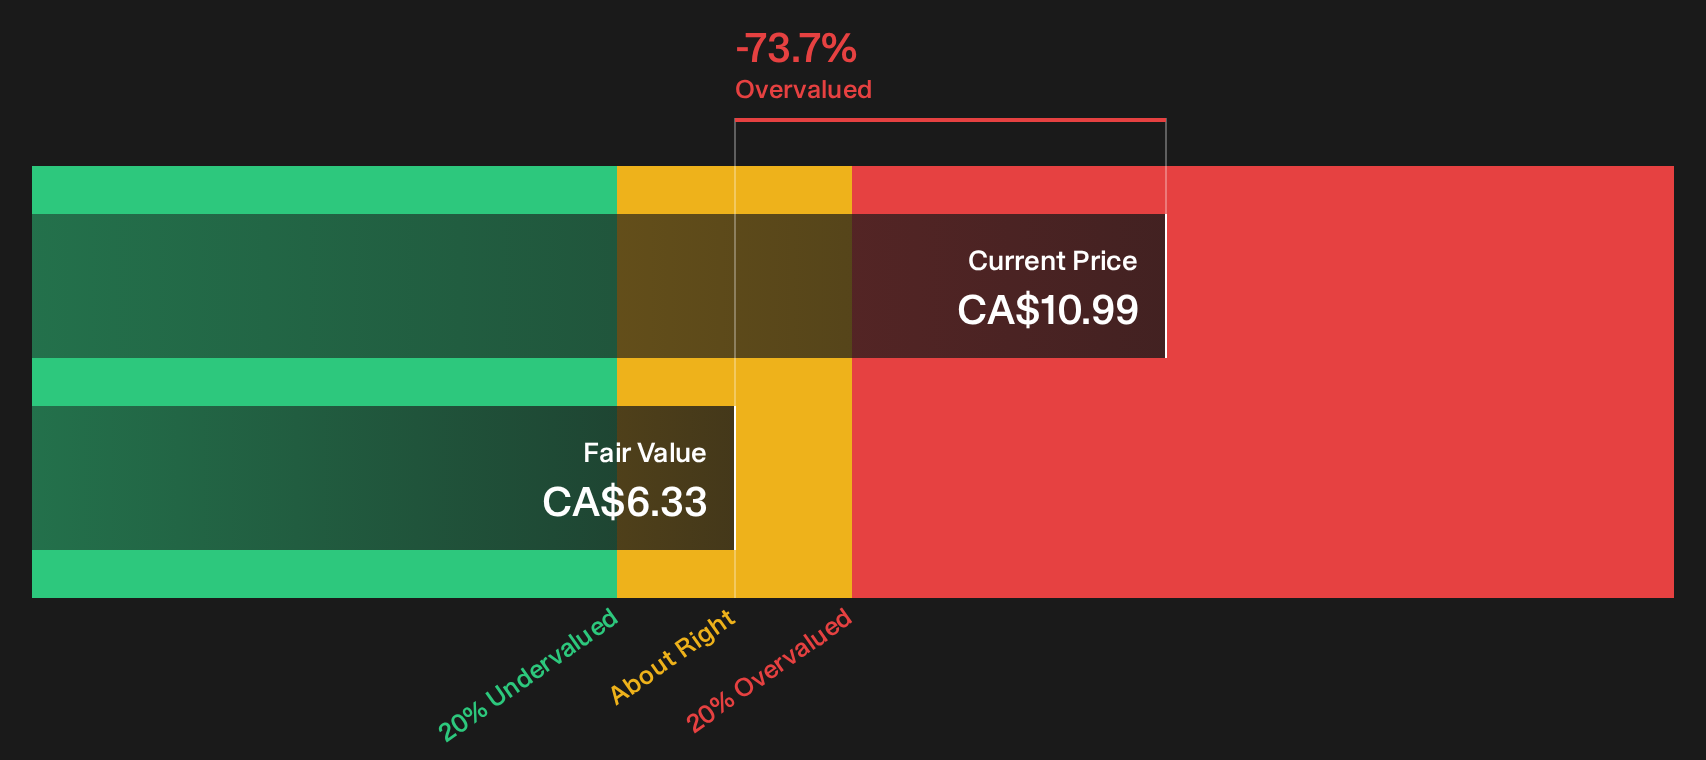
Simply Wall St performs a discounted cash flow (DCF) on every stock in the world every day (check out Kelt Exploration for example). We show the entire calculation in full. You can track the result in your watchlist or portfolio and be alerted when this changes, or use our stock screener to discover 7 high quality undervalued stocks. If you save a screener we even alert you when new companies match - so you never miss a potential opportunity.
Next Steps
Mixed signals around Kelt Exploration can feel confusing, so use that as a prompt to move fast, review the data, and decide where you stand. To balance the upside story with the concerns already on investors’ minds, start by weighing the 1 key reward and 1 important warning sign
Looking for more Kelt Exploration style investment ideas?
Do not stop at Kelt Exploration. Use the same clear, numbers-based approach to hunt for other opportunities that fit your risk profile and return goals.
- Target resilient balance sheets and steady fundamentals by scanning our curated list of solid balance sheet and fundamentals (7 results) that filters for financial strength first.
- Hunt for quality at a discount with the focused 7 high quality undervalued stocks that highlights stocks where fundamentals and pricing may be out of sync.
- Spot potential future leaders before the crowd by combing through the carefully filtered 9 high quality undiscovered gems.
This article by Simply Wall St is general in nature. We provide commentary based on historical data and analyst forecasts only using an unbiased methodology and our articles are not intended to be financial advice. It does not constitute a recommendation to buy or sell any stock, and does not take account of your objectives, or your financial situation. We aim to bring you long-term focused analysis driven by fundamental data. Note that our analysis may not factor in the latest price-sensitive company announcements or qualitative material. Simply Wall St has no position in any stocks mentioned.
Have feedback on this article? Concerned about the content? Get in touch with us directly. Alternatively, email editorial-team@simplywallst.com