
- PRICING
- LIVE QUOTES
- LEARN
- HELP


EN
Is Melexis (ENXTBR:MELE) Overvalued As Its Share Price Sits Well Above Fair Value?
Melexis (ENXTBR:MELE) enters early October with its share price around €66 and a year-to-date gain of about 12%, while the past 3 months show a decline of roughly 9%.
Recent trading paints a mixed picture for Melexis. The share price has given back some ground in the last quarter, even though the year-to-date share price return remains positive and the 1-year total shareholder return is modest.
Compare Melexis with a hand picked group of resilient semiconductor players and broader quality opportunities through the 225 resilient stocks with low risk scores to see how its recent swings stack up against lower risk peers.
Melexis now trades well below its recent highs yet still carries a solid year-to-date gain. Is this pullback already a fair entry point, or does the valuation argue for more patience before buying in?
Most Popular Narrative: 110% Overvalued
On the numbers, Melexis trades at €66.05 while the leading narrative from StoxEurope suggests a fair value of €31.49 per share. That gap raises the question of what kind of assumptions need to hold for today’s price to make sense.
The StoxEurope estimate for Melexis is €31,49 per share, as at 25 September 2026. The share price that day was €66,80.
The estimate comes from the primary model, a discounted cash flow of the whole business. That model was chosen for this company before any value was computed. Across three scenarios it gives:
• Downside, the downturn lingers: €22,82
• Base, the guided recovery holds: €31,49
• Upside, the business moves back towards its 2023 peak: €40,85
These are three described futures, not a statistical confidence interval.
See why 1 investors see Melexis as 110% overvalued.
According to StoxEurope, the difference between their central estimate and the current Melexis share price sits in the assumptions. Their work argues that to justify around €66 per share within the base case, the company would need either an operating margin of 33.96% compared with the best of the last three years at 27.1%, or annual sales growth of 21.97%, or a much lower discount rate than they use in their model. Each of those would be a material shift versus the reference points they outline.
That narrative also flags funding as a pressure point. Once the declared €1.30 interim dividend is factored in, StoxEurope projects modelled cash at the end of the first forecast year between €12.7m and €35.0m below zero across its scenarios. Their view is that investors should pay close attention to how any such shortfall might be addressed, given management has not, in that work, indicated a specific plan for covering it.
For Melexis shareholders, this creates a clear tension between a discounted cash flow framework that points to a fair value of €31.49 and a market price more than double that level. Anyone weighing the stock now is effectively choosing which story to put more weight on, the optimistic market view embedded in the current quotation or the more conservative cash flow path outlined in the StoxEurope research.
Result: Fair Value of €31.49 (OVERVALUED)
Still, Melexis could see this cautious narrative challenged if automotive demand proves more resilient than expected, or if management outlines a clearer plan for future funding needs.
Find out about the key risks to this Melexis narrative.
Another View: Melexis Through Earnings Multiples
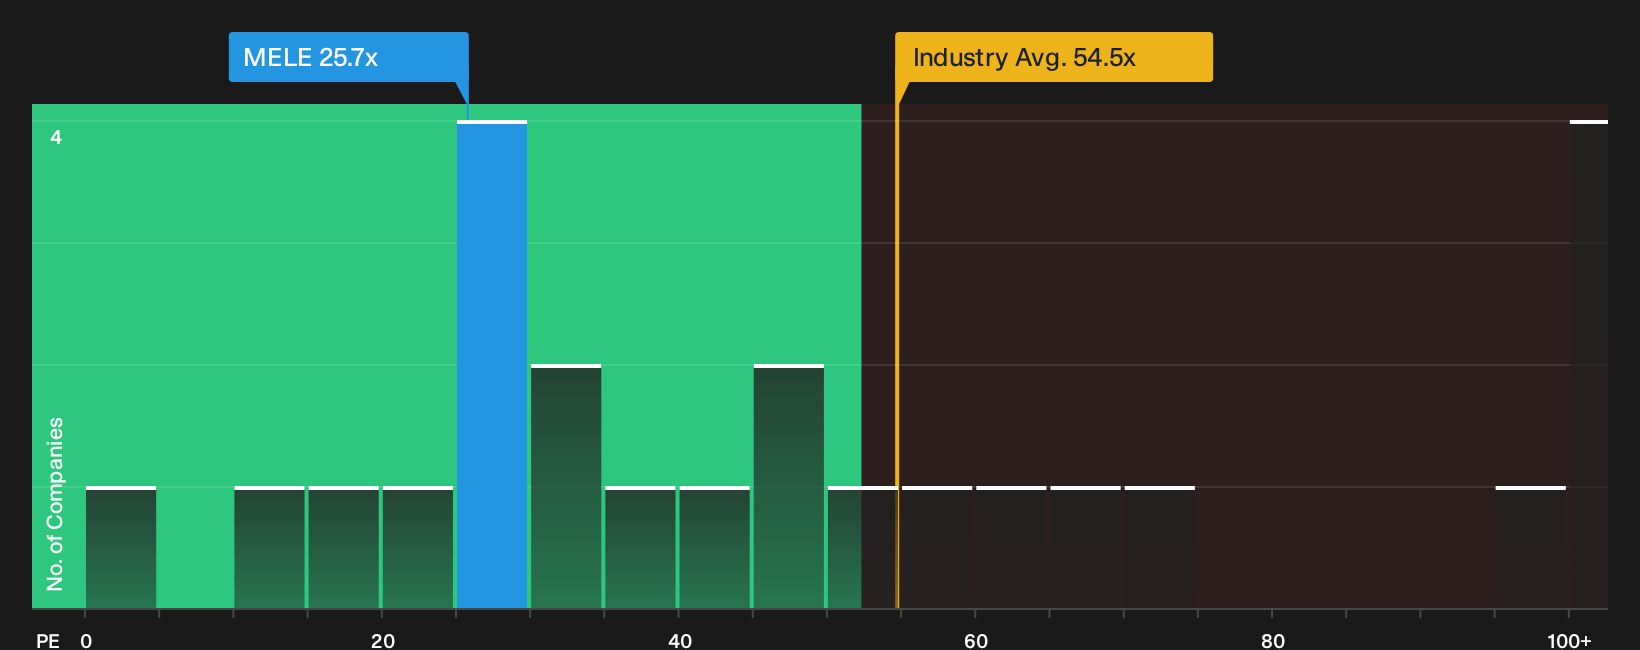
The StoxEurope DCF work paints Melexis as steeply overvalued, yet the current P/E ratio of 25.7x tells a softer story when set beside the European semiconductor average of 54.5x and peer levels around 97x. That gap points to either caution being priced in or an opportunity that others are side-stepping. Which explanation feels more convincing to you as an investor?
For a closer look at how this earnings-based view lines up against the current price, and what that might mean for upside or downside risk, See what the numbers say about this price — find out in our valuation breakdown..
Next Steps
Mixed views always create urgency. Use that to your advantage by checking the underlying numbers, weighing both caution and optimism, and then grounding your decision in the 2 key rewards and 3 important warning signs.
Looking for more Melexis sized investment ideas?
If Melexis has your attention, do not stop here. Use the Simply Wall Street Screener to widen your watchlist with focused, data backed ideas.
- Target reliable payouts by scanning for companies that resemble income anchors through the 224 dividend fortresses.
- Hunt for quality at a sensible price by running a search across potential bargains using the 179 high quality undervalued stocks.
- Strengthen your downside protection by filtering for robust finances with the list of solid balance sheet and fundamentals (206 results).
This article by Simply Wall St is general in nature. We provide commentary based on historical data and analyst forecasts only using an unbiased methodology and our articles are not intended to be financial advice. It does not constitute a recommendation to buy or sell any stock, and does not take account of your objectives, or your financial situation. We aim to bring you long-term focused analysis driven by fundamental data. Note that our analysis may not factor in the latest price-sensitive company announcements or qualitative material. Simply Wall St has no position in any stocks mentioned.
Have feedback on this article? Concerned about the content? Get in touch with us directly. Alternatively, email editorial-team@simplywallst.com