
- PRICING
- LIVE QUOTES
- LEARN
- HELP


EN
SHIMAMURA (TSE:8227) After Half Year Earnings And Dividend Reset Looks Fairly Priced
What SHIMAMURA’s Latest Earnings And Dividend Update Tell Investors
SHIMAMURA (TSE:8227) just paired its half year earnings release with a fresh dividend update that reflects this year’s share split, giving investors new numbers to assess both profitability and cash returns.
Recent trading reflects a mixed picture. SHIMAMURA’s share price return has been slightly positive over the past week while drifting lower over the past quarter and year to date. However, total shareholder return over three and five years has been strong, indicating long term holders have still seen solid compounding from dividends and price gains.
Scan how SHIMAMURA’s earnings and dividend reset compare with other retailers by reviewing our curated list of 14 high quality undervalued stocks that combine cash flow strength with balance sheet resilience.
SHIMAMURA’s half year profit, refreshed dividend and modest share pullback now sit side by side. Does that current mix still skew the risk reward towards buyers as valuation tests the recent move?
Price to Earnings of 14.9x: Is It Justified For SHIMAMURA?
SHIMAMURA trades on a P/E of 14.9x, which sits below its estimated fair P/E of 16.1x yet above the 12.8x average for the JP Specialty Retail group, so the market is paying a mid range earnings multiple for this retailer at a last close of ¥3,282.
The P/E ratio compares the current share price to earnings per share, so it reflects how much investors are willing to pay today for each unit of SHIMAMURA’s profit. For a clothing and home goods chain with a broad customer base in Japan and Taiwan, this earnings multiple helps you gauge whether the current price lines up with its profit profile.
SHIMAMURA’s 14.9x P/E is lower than the peer average of 17.1x, which suggests investors are paying less for each yen of its earnings than for comparable retailers, while the fair P/E estimate of 16.1x points to a level the market could move towards if sentiment and fundamentals stay aligned. At the same time, the multiple sits higher than the 12.8x industry average, which shows the stock is not being treated as a bargain across the whole Specialty Retail space and that expectations for its earnings may be firmer than for some competitors.
Explore the SWS fair ratio for SHIMAMURA.
Result: Price to Earnings of 14.9x (ABOUT RIGHT)
Still, the recent year to date share price drift, along with Japan focused revenue of ¥702,510m and much smaller overseas sales, leaves SHIMAMURA exposed to domestic consumer slowdowns and limited geographic diversification.
Find out about the key risks to this SHIMAMURA narrative.
Another View On SHIMAMURA’s Valuation
The earlier P/E check suggested SHIMAMURA looks roughly in line with its earnings power. A different lens tells a stronger story. Our DCF model points to an estimated value of ¥4,573.71 per share versus the current ¥3,282, which screens as undervalued on that framework.
That kind of gap can reflect either a genuine pricing opportunity or assumptions in the SWS DCF model that prove too generous once conditions change. Which side of that trade do you think you are on?
Look into how the SWS DCF model arrives at its fair value.
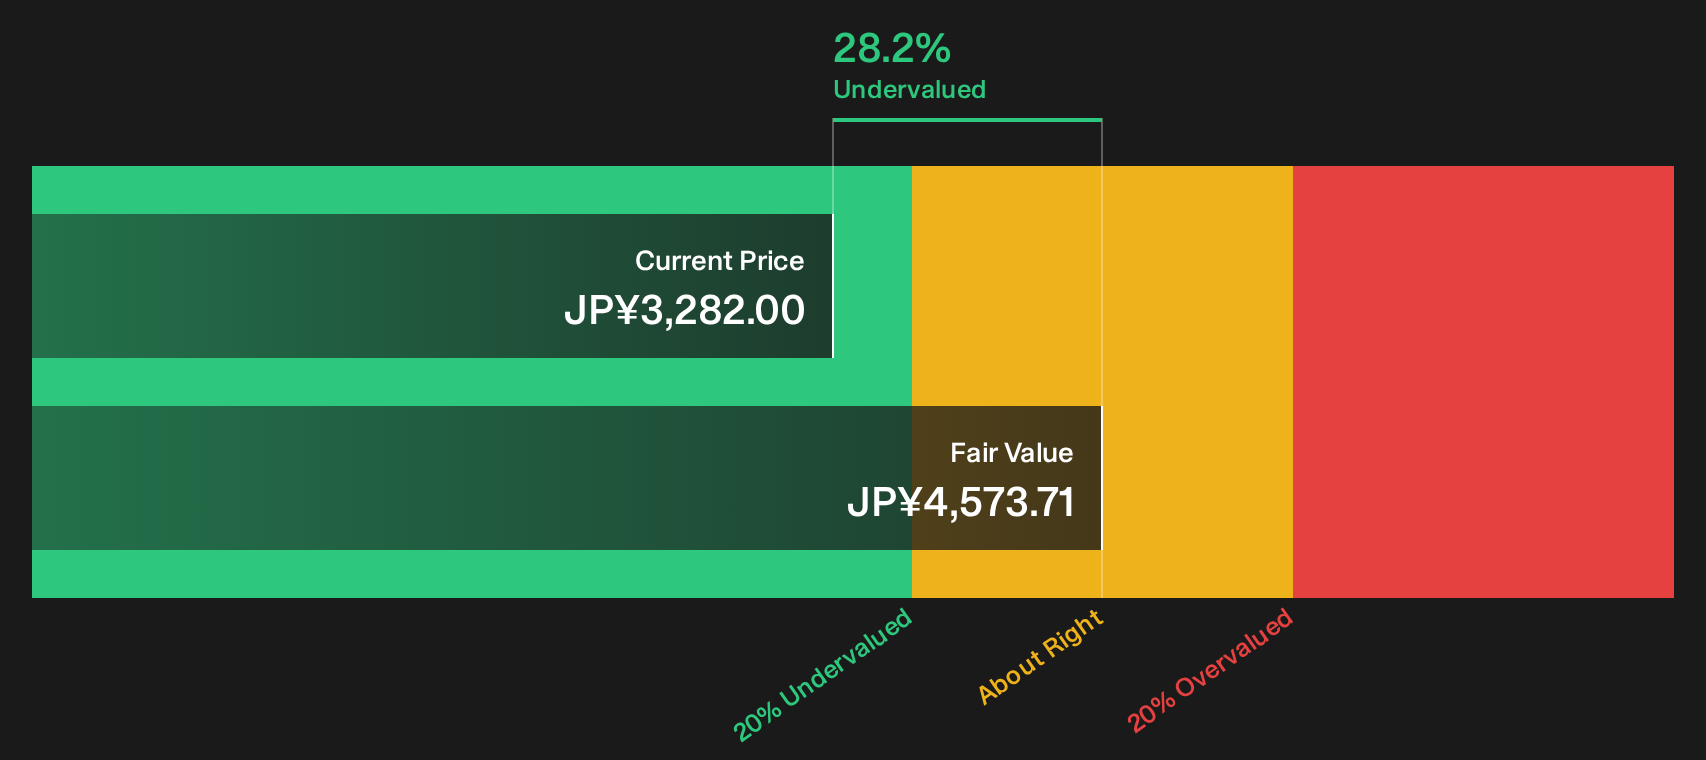
Simply Wall St performs a discounted cash flow (DCF) on every stock in the world every day (check out SHIMAMURA for example). We show the entire calculation in full. You can track the result in your watchlist or portfolio and be alerted when this changes, or use our stock screener to discover 14 high quality undervalued stocks. If you save a screener we even alert you when new companies match - so you never miss a potential opportunity.
Next Steps
Mixed messages or an early opening for SHIMAMURA? If you want to move quickly and build your own stance, start by weighing its 3 key rewards and 1 important warning sign.
Looking For More SHIMAMURA-Like Investment Ideas?
If SHIMAMURA caught your attention, do not stop here. The real edge comes from lining it up against a wider bench of quality candidates.
- Target reliable cash generators by scanning companies with strong cash flows and attractive pricing through the 14 high quality undervalued stocks.
- Strengthen portfolio resilience by focusing on businesses that carry robust finances using the list of solid balance sheet and fundamentals (23 results).
- Hunt for future leaders before the crowd by reviewing the 75 high quality undiscovered gems.
This article by Simply Wall St is general in nature. We provide commentary based on historical data and analyst forecasts only using an unbiased methodology and our articles are not intended to be financial advice. It does not constitute a recommendation to buy or sell any stock, and does not take account of your objectives, or your financial situation. We aim to bring you long-term focused analysis driven by fundamental data. Note that our analysis may not factor in the latest price-sensitive company announcements or qualitative material. Simply Wall St has no position in any stocks mentioned.
Have feedback on this article? Concerned about the content? Get in touch with us directly. Alternatively, email editorial-team@simplywallst.com