
- PRICING
- LIVE QUOTES
- LEARN
- HELP


EN
Yankuang Energy Group (SEHK:1171) Draws Fresh Interest On Undervalued Versus Peers Narrative
Recent commentary on Yankuang Energy Group (SEHK:1171) has zeroed in on its P/E of 9 and solid P/B ratio, as value-focused reports flag the stock as undervalued versus sector peers.
Recent price action shows that Yankuang Energy Group has given investors a bumpy ride, with a 1-day share price return of 2.37% and a 7-day gain of 1.75%, while the 30-day share price return declined 13.11%. At the same time, the 90-day move is up 9.90% and the year-to-date share price return sits at 19.59%. Over a longer horizon, momentum still leans positive, with a 1-year total shareholder return of 16.94% and multi-year total shareholder returns of 39.98% over three years and 184.00% over five years. This helps explain why value-focused commentary around its P/E and P/B ratios is drawing fresh attention at the current HK$11.66 share price.
Compare Yankuang Energy Group with other value-focused opportunities by scanning our hand picked list of 186 high quality undervalued stocks that also pair lower valuation multiples with stronger fundamentals.
Yankuang Energy Group trades at a steep discount to both intrinsic estimates and analyst targets after a choppy month. Is that gap a genuine opportunity, or is the market correctly pricing in extra risk?
Preferred P/E Multiple of 9.3x: Is it justified?
On simple valuation metrics, Yankuang Energy Group looks inexpensive, with a P/E of 9.3x at a last close of HK$11.66, while several comparisons point to a discount versus both peers and the wider Asian oil and gas group.
The P/E ratio compares the current share price with earnings per share. For a coal and energy producer like Yankuang Energy Group, it gives a quick read on how much investors are paying for each unit of profit in a sector where earnings can swing with commodity cycles.
Here, the stock is flagged as good value in multiple ways. The P/E of 9.3x is lower than the Asian oil and gas industry average of 11.7x, and also below a peer average of 17.4x. It is even discounted against an estimated fair P/E of 10.4x, a level the market could potentially move towards if sentiment and fundamentals line up with that reference point.
The comparison is not one sided though. Forecast earnings growth of 5.86% per year and revenue growth of 2.3% per year are slower than projections for the Hong Kong market overall, and Return on Equity is described as low at 8.9%, with a forecast of 14.2% in three years still short of the 20% threshold often used as a quality marker. Those factors help explain why the multiple may be restrained even while it screens as attractive against sector and peer benchmarks.
Result: Price-to-Earnings of 9.3x (UNDERVALUED)
Explore the SWS fair ratio for Yankuang Energy Group.
Still, the coal heavy mix and relatively low 8.9% Return on Equity leave room for earnings pressure if demand, regulation, or capital allocation missteps bite.
Find out about the key risks to this Yankuang Energy Group narrative.
Another view on Yankuang Energy Group’s value
Multiples present Yankuang Energy Group as inexpensive, while the SWS DCF model indicates something far more extreme. At a share price of HK$11.66, the stock is described as trading about 87.2% below an estimated future cash flow value of HK$91.25. Is that a genuine bargain or a sign that the model is too optimistic?
Look into how the SWS DCF model arrives at its fair value.
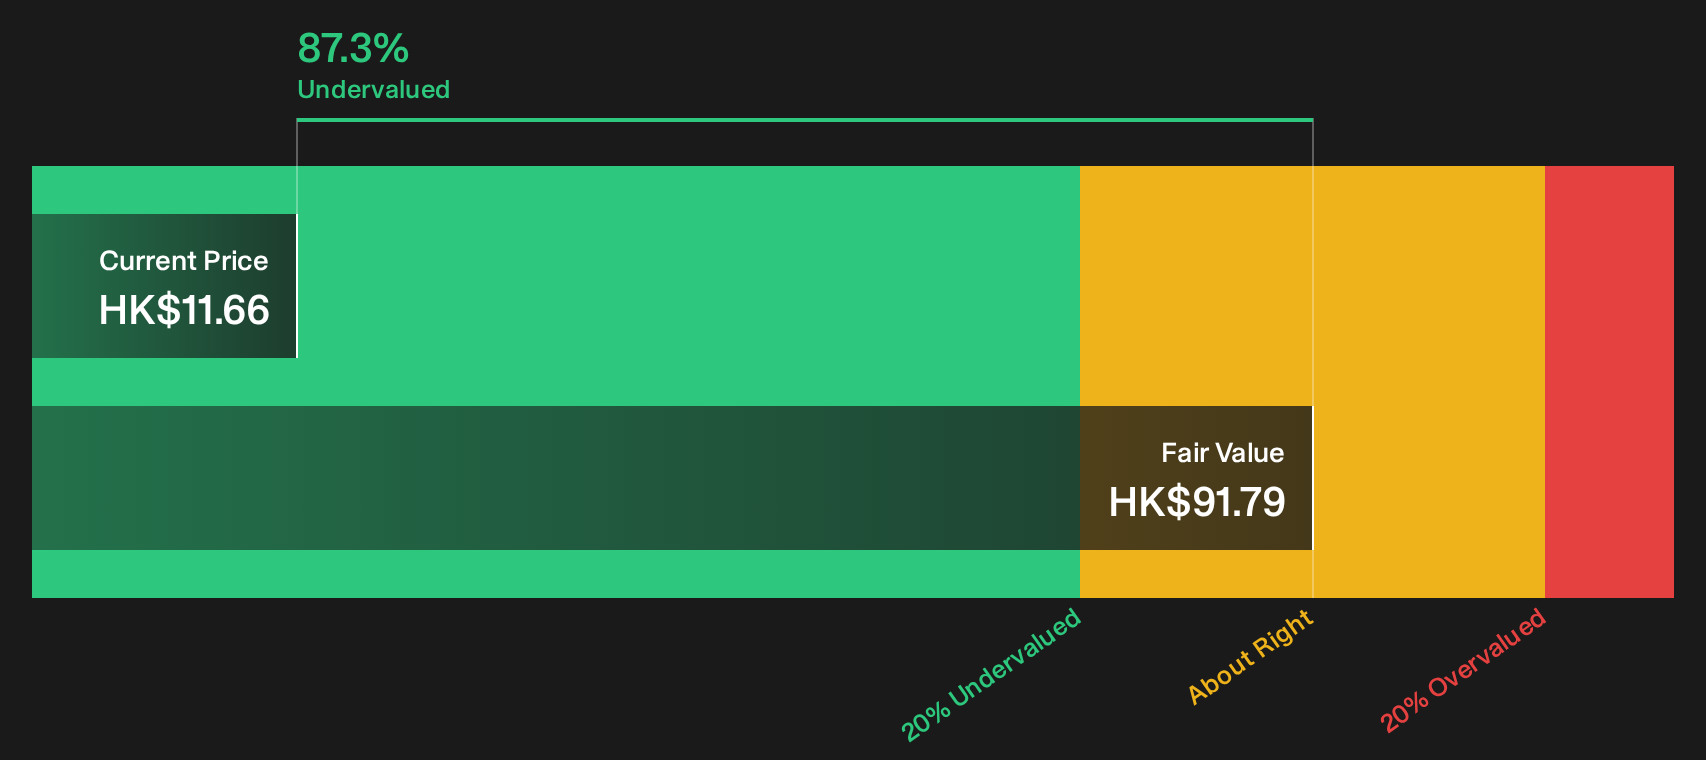
Simply Wall St performs a discounted cash flow (DCF) on every stock in the world every day (check out Yankuang Energy Group for example). We show the entire calculation in full. You can track the result in your watchlist or portfolio and be alerted when this changes, or use our stock screener to discover 186 high quality undervalued stocks. If you save a screener we even alert you when new companies match - so you never miss a potential opportunity.
Next Steps
Mixed signals around Yankuang Energy Group can feel confusing, so use that as a prompt to move fast. Review the full picture and decide where you stand by weighing the 3 key rewards and 1 important warning sign
Looking for more investment ideas beyond Yankuang Energy Group?
Do not stop your research with Yankuang Energy Group. Broaden your watchlist now so you are not late when the next opportunity lines up.
- Target potential mispricings across the market by scanning a curated 186 high quality undervalued stocks that blend lower valuation multiples with resilient business profiles.
- Strengthen capital protection by focusing on companies from a 226 resilient stocks with low risk scores where balance sheet quality and risk scores work in your favor.
- Spot future leaders early by reviewing a 618 high quality undiscovered gems that combines strong fundamentals with relatively low market attention.
This article by Simply Wall St is general in nature. We provide commentary based on historical data and analyst forecasts only using an unbiased methodology and our articles are not intended to be financial advice. It does not constitute a recommendation to buy or sell any stock, and does not take account of your objectives, or your financial situation. We aim to bring you long-term focused analysis driven by fundamental data. Note that our analysis may not factor in the latest price-sensitive company announcements or qualitative material. Simply Wall St has no position in any stocks mentioned.
Have feedback on this article? Concerned about the content? Get in touch with us directly. Alternatively, email editorial-team@simplywallst.com