
- PRICING
- LIVE QUOTES
- LEARN
- HELP


EN
Genesis Energy (GEL) Pulls Back, Is The Valuation Gap Too Wide To Ignore?
Genesis Energy (GEL) has drawn fresh attention after recent trading left the units down about 10% over the past month and roughly 4% lower over the past 3 months.
For context, Genesis Energy units now trade at about $14.32, and that recent slide sits against a year-to-date share price return that is down roughly 10%, while the 3-year total shareholder return of about 62% points to a very different longer term story.
See how Genesis Energy compares with other income focused infrastructure investments by reviewing our hand picked list of 8 dividend fortresses.
The recent pullback leaves Genesis Energy on a very different footing from its multi year return profile. Does that reset tilt the risk reward toward buyers, or signal that investors still want a bigger discount before stepping in?
Price-to-Earnings of 71.2x: Is it justified?
Genesis Energy now changes hands at $14.32, yet the units trade on a P/E of 71.2x, which is far richer than many investors would expect for an income focused midstream operator.
The P/E ratio compares the current unit price to earnings per unit and, in effect, shows how many dollars investors are paying for each dollar of profit. For a partnership like Genesis Energy, a high P/E can signal that the market is putting a premium on its recent move into profitability or expecting that profitability to be maintained after a period of losses.
Context matters here. Genesis Energy only became profitable in the past year and that shift is influenced by large one off items, including a gain of $32.3m that affects the last 12 months of reported results. That type of non recurring benefit can inflate earnings, which pushes the P/E figure lower than it might otherwise be, yet the ratio still comes out at a steep 71.2x, suggesting the market is paying a high price relative to underlying, recurring profit.
Set against peers, the gap is wide. Management is running a midstream partnership that, according to the data, trades on a P/E of 71.2x compared with about 12.3x for the broader US Oil and Gas industry and 10.6x for its closer peer group. That marks Genesis Energy as expensive on this preferred multiple, both against the sector and against similar businesses.
See what the numbers say about this price — find out in our valuation breakdown.
Result: Price-to-Earnings of 71.2x (OVERVALUED)
Still, Genesis Energy faces clear risks to that story, including annual revenue that declined about 5% and a relatively modest net income of $24.6m on $1.8b of sales.
Find out about the key risks to this Genesis Energy narrative.
Another View on Genesis Energy's value
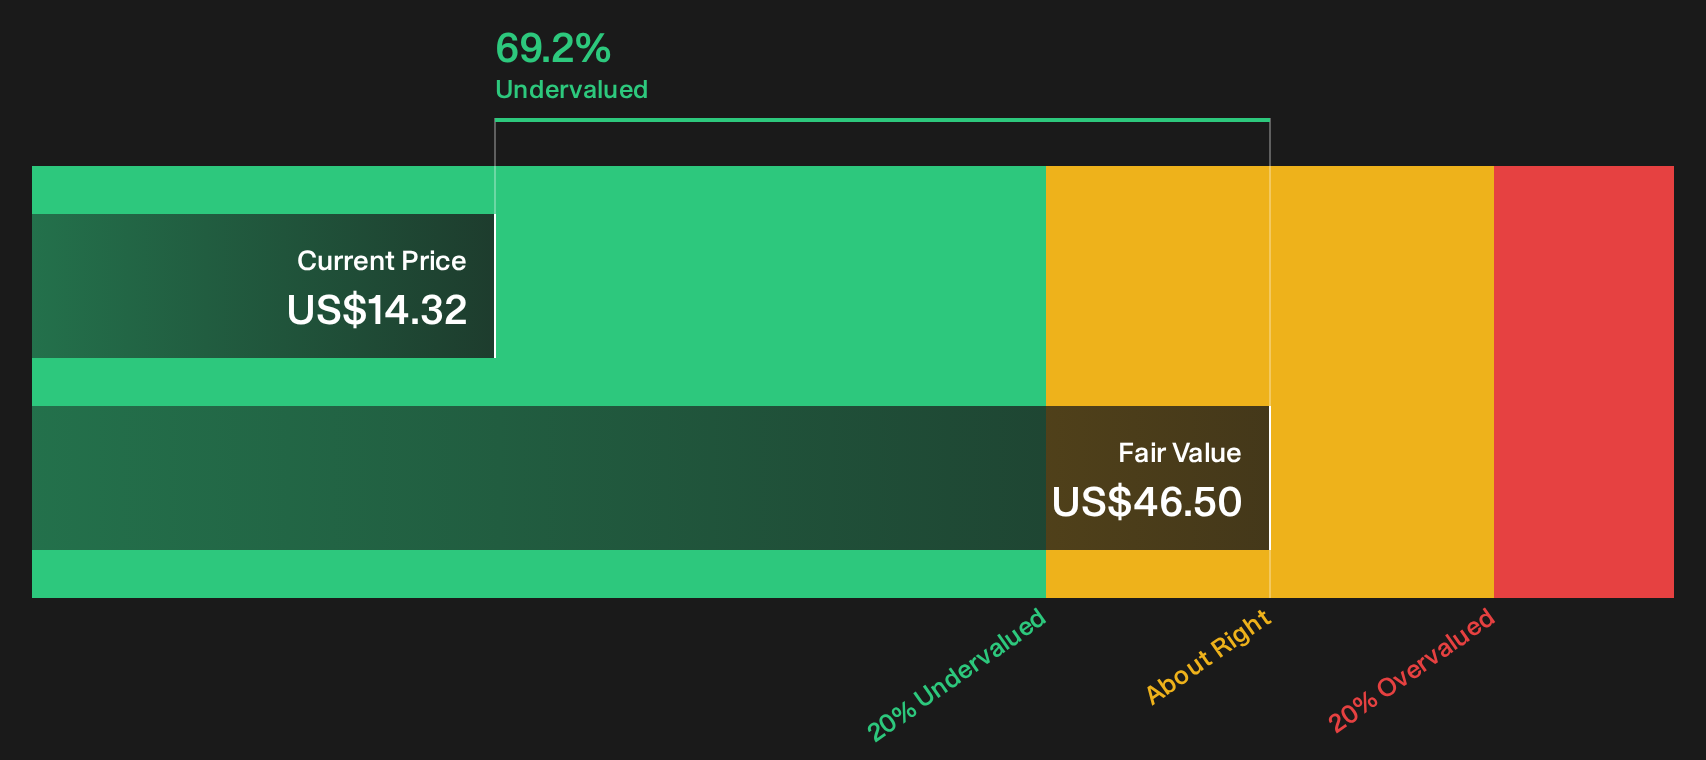
The rich 71.2x P/E suggests Genesis Energy is expensive, yet the SWS DCF model points the other way. On that cash flow based approach, a price of $14.32 sits well below an estimated future cash flow value of $46.50, implying the units trade at a steep discount instead.
Both methods use the same business but tell very different stories. One leans on current reported earnings that include large one off items. The other leans on long term cash flows. Which set of assumptions do you trust more when you consider your own time horizon and risk appetite?
Look into how the SWS DCF model arrives at its fair value.
Simply Wall St performs a discounted cash flow (DCF) on every stock in the world every day (check out Genesis Energy for example). We show the entire calculation in full. You can track the result in your watchlist or portfolio and be alerted when this changes, or use our stock screener to discover 29 high quality undervalued stocks. If you save a screener we even alert you when new companies match - so you never miss a potential opportunity.
Next Steps
With Genesis Energy raising both concerns and optimism, the real question is how you weigh those signals against your own goals and risk tolerance. Take a closer look at the full balance of upsides and downsides by reviewing the 3 key rewards and 3 important warning signs
Looking for more investment ideas beyond Genesis Energy?
If you stop with Genesis Energy, you risk missing other opportunities that better fit your goals, time horizon, or comfort with risk and volatility.
- Target durable quality by reviewing a list of solid balance sheet and fundamentals (25 results) that highlights companies with stronger financial foundations and fewer balance sheet surprises.
- Hunt for mispriced potential with the 20 high quality undiscovered gems that shines a light on underfollowed businesses with solid fundamentals.
- Prioritize resilience and sleep better at night by scanning 31 resilient stocks with low risk scores tailored toward stocks with lower overall risk scores.
This article by Simply Wall St is general in nature. We provide commentary based on historical data and analyst forecasts only using an unbiased methodology and our articles are not intended to be financial advice. It does not constitute a recommendation to buy or sell any stock, and does not take account of your objectives, or your financial situation. We aim to bring you long-term focused analysis driven by fundamental data. Note that our analysis may not factor in the latest price-sensitive company announcements or qualitative material. Simply Wall St has no position in any stocks mentioned.
Have feedback on this article? Concerned about the content? Get in touch with us directly. Alternatively, email editorial-team@simplywallst.com