
- PRICING
- LIVE QUOTES
- LEARN
- HELP


EN
Is Graham Holdings (GHC) Undervalued After Its Fresh Dividend Declaration?
Graham Holdings (GHC) has drawn fresh attention after declaring a cash dividend of $1.88 per share, with an ex-dividend date set for October 15, 2026. This development is putting income considerations back on investors’ radar.
Graham Holdings shares changed hands at US$1,169.60 on the latest close, with a 7.57% year to date share price return and an 8.10% total shareholder return over one year. The 3 year and 5 year total shareholder returns of 101.37% and 110.13% point to momentum that has been building rather than fading.
Scan beyond Graham Holdings and compare its dividend profile with a curated 8 dividend fortresses designed for income-focused investors.
Bulls point to Graham Holdings’ diversified earnings base and fresh dividend, while bears focus on the rich share price. Which side does the current valuation actually support?
Preferred P/E of 9.2x for Graham Holdings: Is it justified?
On the numbers, Graham Holdings looks inexpensive next to peers, with a P/E of 9.2x while the peer group sits at 17.3x and the wider US Consumer Services industry at 13x. That gap matters when the last close is $1,169.60 and the share price has already outperformed the sector over the past year.
The P/E ratio compares what investors are paying today for each dollar of current earnings. For a diversified holding company like Graham Holdings, which spans education, healthcare, manufacturing, media and automotive, this single figure compresses a mix of mature and growth-oriented operations into one earnings-based snapshot.
The earnings picture is not one way. Management has grown profits by 13.9% per year over the past 5 years, yet the most recent year showed a 20.3% decline in earnings and net profit margins eased from 14% to 10.7%. Reported profit quality is also affected by a large one off gain of $166.4m, which flatters the last 12 months and makes the current P/E look cheaper than it might on fully normalized earnings.
Even with those caveats, the comparison is punchy. A 9.2x P/E against a 17.3x peer average and a 13x industry average suggests the market is assigning a clear discount to Graham Holdings despite its diversified revenue base and long operating history. That spread frames the debate on whether investors are being conservative about the recent earnings decline or underestimating the long term earnings power of the portfolio.
See what the numbers say about this price — find out in our valuation breakdown.
Result: Price-to-earnings of 9.2x (UNDERVALUED)
Still, the earnings slip, alongside rich analyst targets and that large one off gain, could quickly challenge the idea that Graham Holdings is simply cheap.
Find out about the key risks to this Graham Holdings narrative.
Another View on Graham Holdings: What the DCF Says
There is a very different message coming from the SWS DCF model. On that framework, Graham Holdings at $1,169.60 is trading at a steep discount to an estimated future cash flow value of $3,000.85 per share. This implies the cash generation profile is being priced very cautiously.
For investors, that kind of gap can signal either a margin of safety if the cash flows prove resilient or a warning that the inputs are too optimistic. The key question is which side of that line you think Graham Holdings belongs on.
Look into how the SWS DCF model arrives at its fair value.
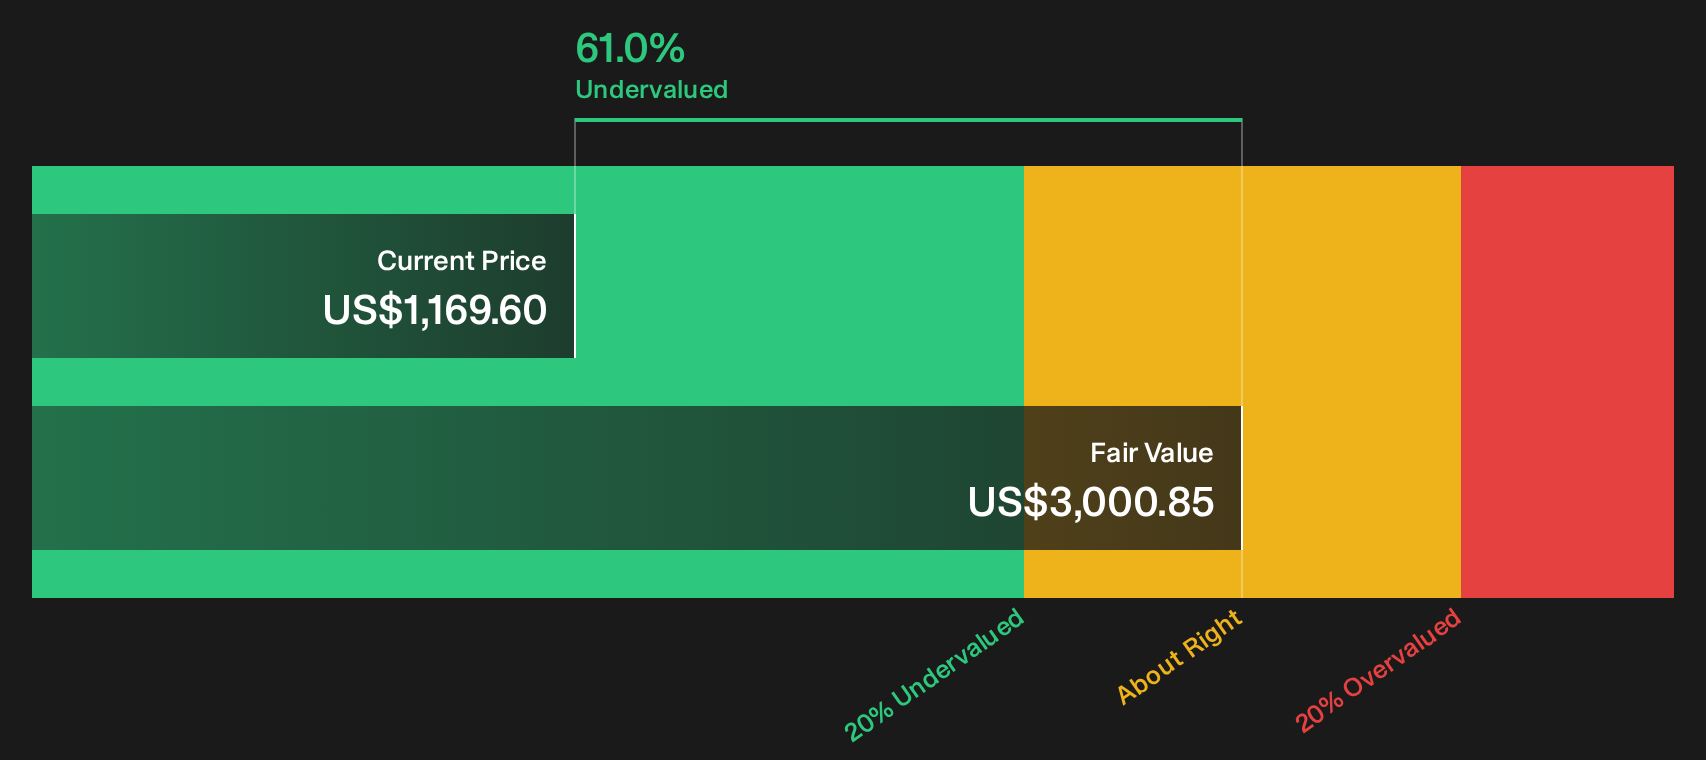
Simply Wall St performs a discounted cash flow (DCF) on every stock in the world every day (check out Graham Holdings for example). We show the entire calculation in full. You can track the result in your watchlist or portfolio and be alerted when this changes, or use our stock screener to discover 29 high quality undervalued stocks. If you save a screener we even alert you when new companies match - so you never miss a potential opportunity.
Next Steps
With Graham Holdings pulling in both optimism and caution, you have enough data on the table to stress test your own thesis before the market moves. To weigh those concerns against the potential upside, check the balance of 1 key reward and 1 important warning sign.
Looking for more investment ideas beyond Graham Holdings?
Do not stop your research with Graham Holdings. Use the screener to widen your watchlist and pressure test your income, value and risk assumptions across other opportunities.
- Target stronger income potential by scanning for reliable high yield opportunities using the 8 dividend fortresses.
- Hunt for mispriced quality and see which companies look overlooked on fundamentals with the 20 high quality undiscovered gems.
- Prioritise resilience first and filter for businesses with sturdier financial footing through the list of solid balance sheet and fundamentals (25 results).
This article by Simply Wall St is general in nature. We provide commentary based on historical data and analyst forecasts only using an unbiased methodology and our articles are not intended to be financial advice. It does not constitute a recommendation to buy or sell any stock, and does not take account of your objectives, or your financial situation. We aim to bring you long-term focused analysis driven by fundamental data. Note that our analysis may not factor in the latest price-sensitive company announcements or qualitative material. Simply Wall St has no position in any stocks mentioned.
Have feedback on this article? Concerned about the content? Get in touch with us directly. Alternatively, email editorial-team@simplywallst.com