
- PRICING
- LIVE QUOTES
- LEARN
- HELP


EN
Is CPI Property Group (XTRA:O5G) Still Undervalued Or Already Fully Valued?
CPI Property Group (XTRA:O5G) continues to draw attention after recent trading left the share price at €0.74, with investors weighing its €6.01b market value against an intrinsic discount of about 49%.
Recent trading has been choppy for CPI Property Group, with a small 1-day share price return of 0.68% and a 30-day gain of 1.37% set against a year-to-date share price decline of 5.13% and a 1-year total shareholder return that is down 9.20%, which hints at fading momentum despite the modest long-term 5-year total shareholder return of 4.23%.
Scan beyond CPI Property Group and compare its recent slump against a hand-picked group of real estate players with 225 resilient stocks with low risk scores in the same space.
CPI Property Group trades at €0.74 with a claimed 49% discount to intrinsic value already on the table. Does that gap still offer a favourable risk reward, or has most of the upside argument been used up?
Preferred price to sales ratio of 4.4x, is it justified for CPI Property Group?
For CPI Property Group, the key reference point is its price to sales ratio of 4.4x, which sits above both peer and wider German real estate averages, even with the share price at €0.74.
P/S compares the market value of the equity to the annual revenue that the business generates. For property investors and developers like CPI Property Group, where earnings can swing with fair value movements and financing costs, this sales based yardstick can give a cleaner view of how the market values each euro of top line.
The current 4.4x level is described as expensive relative to a hand picked peer group on 2.6x P/S. That gap implies buyers are paying a higher multiple of revenue for CPI Property Group, despite the firm reporting a loss of €112.7m on revenue of €1,366.0m and carrying interest payments that are not well covered by earnings.
Compared with the broader German real estate industry average P/S of 2.8x, the stock also trades at a richer valuation. That stronger pricing sits alongside a negative return on equity of 1.16% and losses that have widened at an annual rate of 48.8% over the past 5 years, which raises questions about whether this premium is grounded in the current financial profile or in expectations that are not captured in the historic numbers.
See what the numbers say about this price — find out in our valuation breakdown.
Result: Price to sales ratio of 4.4x (OVERVALUED).
Still, a widening loss of €112.7m and interest costs that are not well covered by earnings could quickly challenge the bullish CPI Property Group thesis.
Find out about the key risks to this CPI Property Group narrative.
Another view on CPI Property Group’s valuation
The SWS DCF model points a different way. On this view, CPI Property Group at €0.74 is trading above an estimated future cash flow value of €0.50, which implies the shares look overvalued rather than cheap. So which lens do you trust when the story flips this hard?
Look into how the SWS DCF model arrives at its fair value.
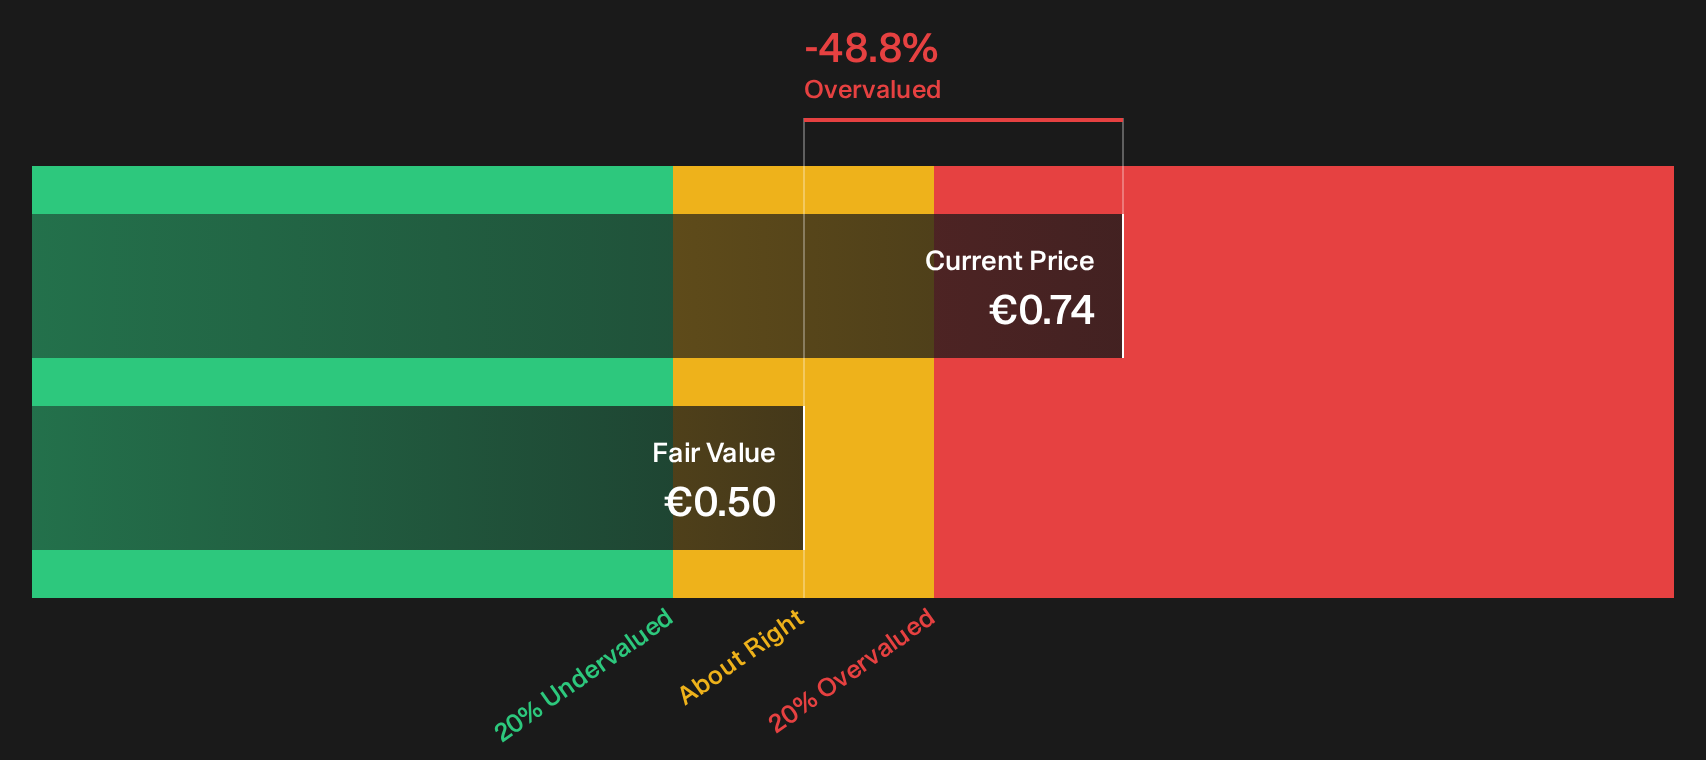
Simply Wall St performs a discounted cash flow (DCF) on every stock in the world every day (check out CPI Property Group for example). We show the entire calculation in full. You can track the result in your watchlist or portfolio and be alerted when this changes, or use our stock screener to discover 184 high quality undervalued stocks. If you save a screener we even alert you when new companies match - so you never miss a potential opportunity.
Next Steps
With CPI Property Group showing mixed valuation signals, you do not need to wait for consensus. Act quickly, review the underlying figures, and see how they line up against the 2 important warning signs.
Looking for more CPI Property Group style investment ideas?
If CPI Property Group has sharpened your focus on valuation and risk, do not stop here. Use the screener to quickly surface fresh, data rich ideas aligned with your goals.
- Target potential mispriced opportunities by scanning a curated set of 184 high quality undervalued stocks that pair quality fundamentals with appealing price tags.
- Strengthen portfolio resilience by reviewing a list of solid balance sheet and fundamentals (207 results) built to handle tougher conditions without stretching finances.
- Get ahead of the crowd by filtering for 619 high quality undiscovered gems that combine solid metrics with relatively low market attention.
This article by Simply Wall St is general in nature. We provide commentary based on historical data and analyst forecasts only using an unbiased methodology and our articles are not intended to be financial advice. It does not constitute a recommendation to buy or sell any stock, and does not take account of your objectives, or your financial situation. We aim to bring you long-term focused analysis driven by fundamental data. Note that our analysis may not factor in the latest price-sensitive company announcements or qualitative material. Simply Wall St has no position in any stocks mentioned.
Have feedback on this article? Concerned about the content? Get in touch with us directly. Alternatively, email editorial-team@simplywallst.com