
- PRICING
- LIVE QUOTES
- LEARN
- HELP


EN
Rayonier (RYN) And The Case For A Cheaper Looking Timber REIT
Rayonier (RYN) has drawn attention after its share price closed at $17.99 in recent trading, leaving the timber-focused REIT down over the past month and the past 3 months.
Recent trading fits a broader pattern for Rayonier, with the share price return down 12.07% over the past 30 days and 13.92% over 90 days. This has contributed to a weaker year-to-date share price performance and a 1-year total shareholder return that has declined 24.75%. These moves point to fading momentum as investors reassess both growth prospects and perceived risk around the timber REIT story.
Compare Rayonier's recent pullback with other real estate and infrastructure plays by scanning list of solid balance sheet and fundamentals (25 results) that may be better positioned for your watchlist.
Bulls point to Rayonier's timber assets and recent revenue and net income growth. Bears see a falling share price and weak multi year returns. Which side does current valuation support next?
Most Popular Narrative: 31% Undervalued
Against Rayonier's last close at $17.99, the most followed valuation view anchors fair value at $26, which frames the recent share price slide as a potential disconnect between assets and quoted price.
Continued conversion of Southern timberland into rural HBU sales and larger development projects such as Wildlight, Heartwood and Chenal, where management points to 50 to 100% premiums on recent rural tracts and the potential for 10 to 15 times higher values on development acres, has scope to lift real estate revenue and segment margins as more acres are brought to market.
See why 22 investors see Rayonier as 31% undervalued.
Result: Fair Value of $26 (UNDERVALUED)
Still, Rayonier's story can unravel if pulpwood demand stays soft or if its lumpy real estate and solar deal pipeline stalls instead of closing.
Find out about the key risks to this Rayonier narrative.
Another View On Rayonier’s Valuation
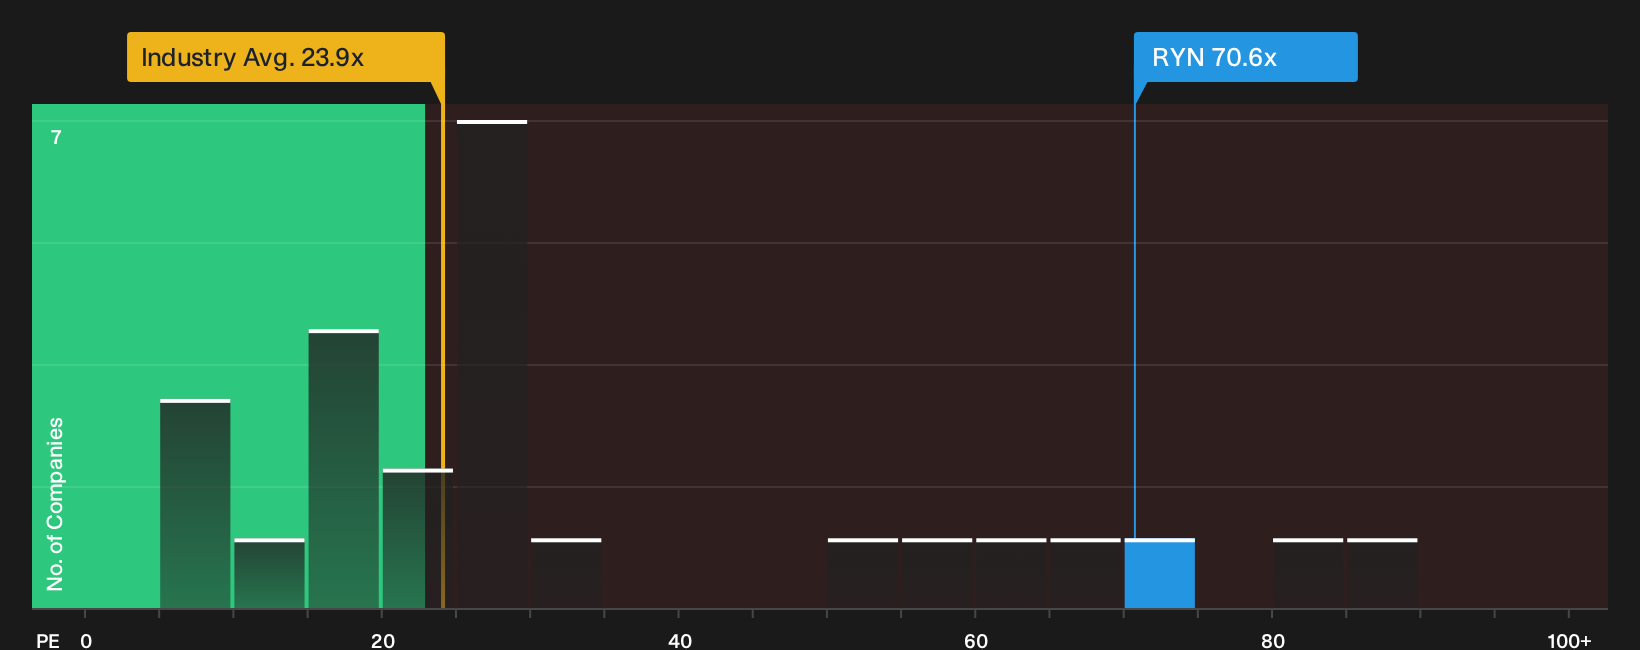
On price targets and fair value models, Rayonier looks cheap. On earnings, the picture flips. The stock trades on a P/E of about 70.6x, compared with a North American Specialized REITs average of 24x and a peer group near 18.7x. The fair ratio sits lower at 65.6x, which points to limited room for error if profit delivery falls short. Which yardstick do you trust most when earnings quality and future growth are both in play?
To see how this earnings based view stacks up against other approaches to valuing Rayonier, See what the numbers say about this price — find out in our valuation breakdown.
Next Steps
Mixed signals around Rayonier often create as many questions as answers, so move quickly and review the full data set yourself before sentiment shifts. To weigh both the upside case and the concerns side by side, start with the 2 key rewards and 4 important warning signs.
Looking for more investment ideas beyond Rayonier?
If Rayonier is on your radar, broaden your options and line up a few backup ideas now so you are not reacting after the next big move.
- Target cash rich balance sheets by scanning the list of solid balance sheet and fundamentals (25 results) and focus on businesses with room to handle pressure without rushing to raise capital.
- Hunt for mispriced quality and use the 29 high quality undervalued stocks to spot companies where fundamentals and current pricing tell two very different stories.
- Prioritise resilience by running the 31 resilient stocks with low risk scores and concentrate on stocks that have historically carried lower overall risk scores.
This article by Simply Wall St is general in nature. We provide commentary based on historical data and analyst forecasts only using an unbiased methodology and our articles are not intended to be financial advice. It does not constitute a recommendation to buy or sell any stock, and does not take account of your objectives, or your financial situation. We aim to bring you long-term focused analysis driven by fundamental data. Note that our analysis may not factor in the latest price-sensitive company announcements or qualitative material. Simply Wall St has no position in any stocks mentioned.
Have feedback on this article? Concerned about the content? Get in touch with us directly. Alternatively, email editorial-team@simplywallst.com