
- PRICING
- LIVE QUOTES
- LEARN
- HELP


EN
3 Asian Stocks Trading At Discounts Up To 49.4% Below Intrinsic Value Estimates
Amidst a backdrop of mixed performances in global markets, Asian equities have shown resilience despite ongoing economic challenges and geopolitical tensions. As investors seek opportunities in this complex environment, identifying undervalued stocks becomes crucial for those looking to capitalize on potential market inefficiencies.
Top 10 Undervalued Stocks Based On Cash Flows In Asia
| Name | Current Price | Fair Value (Est) | Discount (Est) |
| TOKAI (TSE:9729) | ¥2550.00 | ¥5037.09 | 49.4% |
| Shanghai Flyco Electrical Appliance (SHSE:603868) | CN¥31.09 | CN¥61.06 | 49.1% |
| Riken Technos (TSE:4220) | ¥2437.00 | ¥4804.73 | 49.3% |
| PAL GROUP Holdings (TSE:2726) | ¥1446.00 | ¥2866.69 | 49.6% |
| Nissui (TSE:1332) | ¥1106.50 | ¥2180.59 | 49.3% |
| Morinaga Milk Industry (TSE:2264) | ¥1061.00 | ¥2118.18 | 49.9% |
| Foxconn Industrial Internet (SHSE:601138) | CN¥58.20 | CN¥114.44 | 49.1% |
| China Coal Energy (SEHK:1898) | HK$10.15 | HK$19.95 | 49.1% |
| BuySell TechnologiesLtd (TSE:7685) | ¥2765.00 | ¥5529.45 | 50% |
| APAC Realty (SGX:CLN) | SGD0.52 | SGD1.03 | 49.7% |
We're going to check out a few of the best picks from our screener tool.
Hancom (KOSDAQ:A030520)
Overview: Hancom Inc. is a company that develops and sells office software products and solutions both in South Korea and internationally, with a market cap of ₩416.56 billion.
Operations: The company's revenue segments include the Non-Financial - SW Division at ₩203.53 billion, Non-Financial - Manufacturing Sector at ₩135.19 billion, Non-Financial - Other Sectors at ₩27.50 billion, and Finance - Financial Sector at ₩3.92 billion.
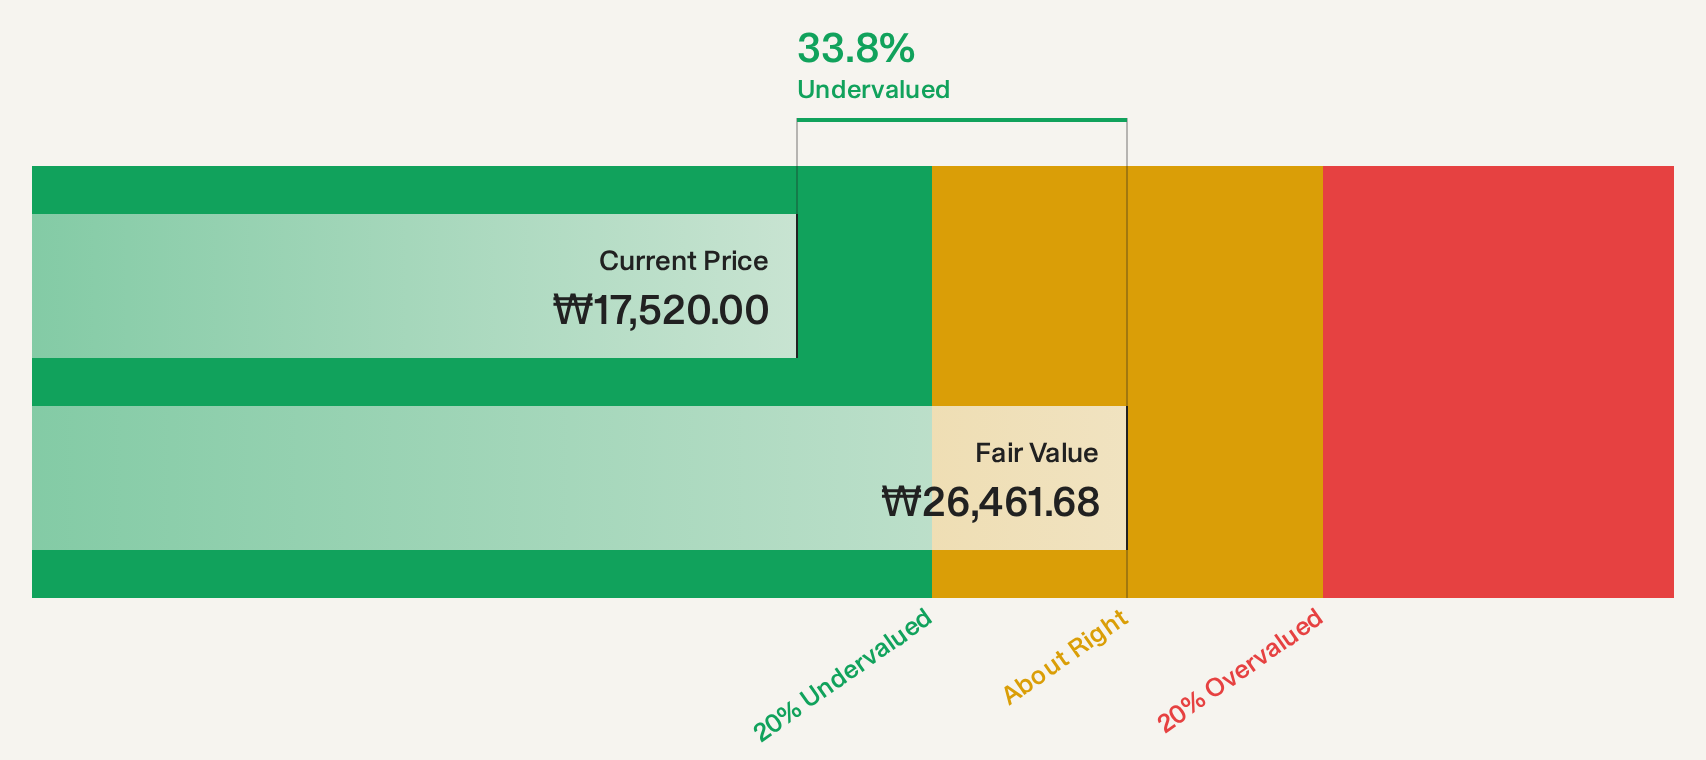
Estimated Discount To Fair Value: 33.7%
Hancom is trading at ₩17,530, significantly below its estimated future cash flow value of ₩26,423.75 and 33.7% under its fair value estimate. Despite impressive earnings growth of 205.2% last year, the company faces slower forecasted revenue (9.1%) and earnings growth (3.1%) compared to the Korean market averages. The presence of large one-off items may affect perceived earnings quality, while future Return on Equity is expected to remain low at 10.1%.
- Insights from our recent growth report point to a promising forecast for Hancom's business outlook.
- Get an in-depth perspective on Hancom's balance sheet by reading our health report here.
Elecom (TSE:6750)
Overview: Elecom Co., Ltd. develops, manufactures, and sells personal computers and digital equipment-related products both in Japan and internationally, with a market cap of ¥161.08 billion.
Operations: The company's revenue primarily comes from the development, manufacturing, and sales of PC, digital devices, and related products, totaling ¥137.41 billion.
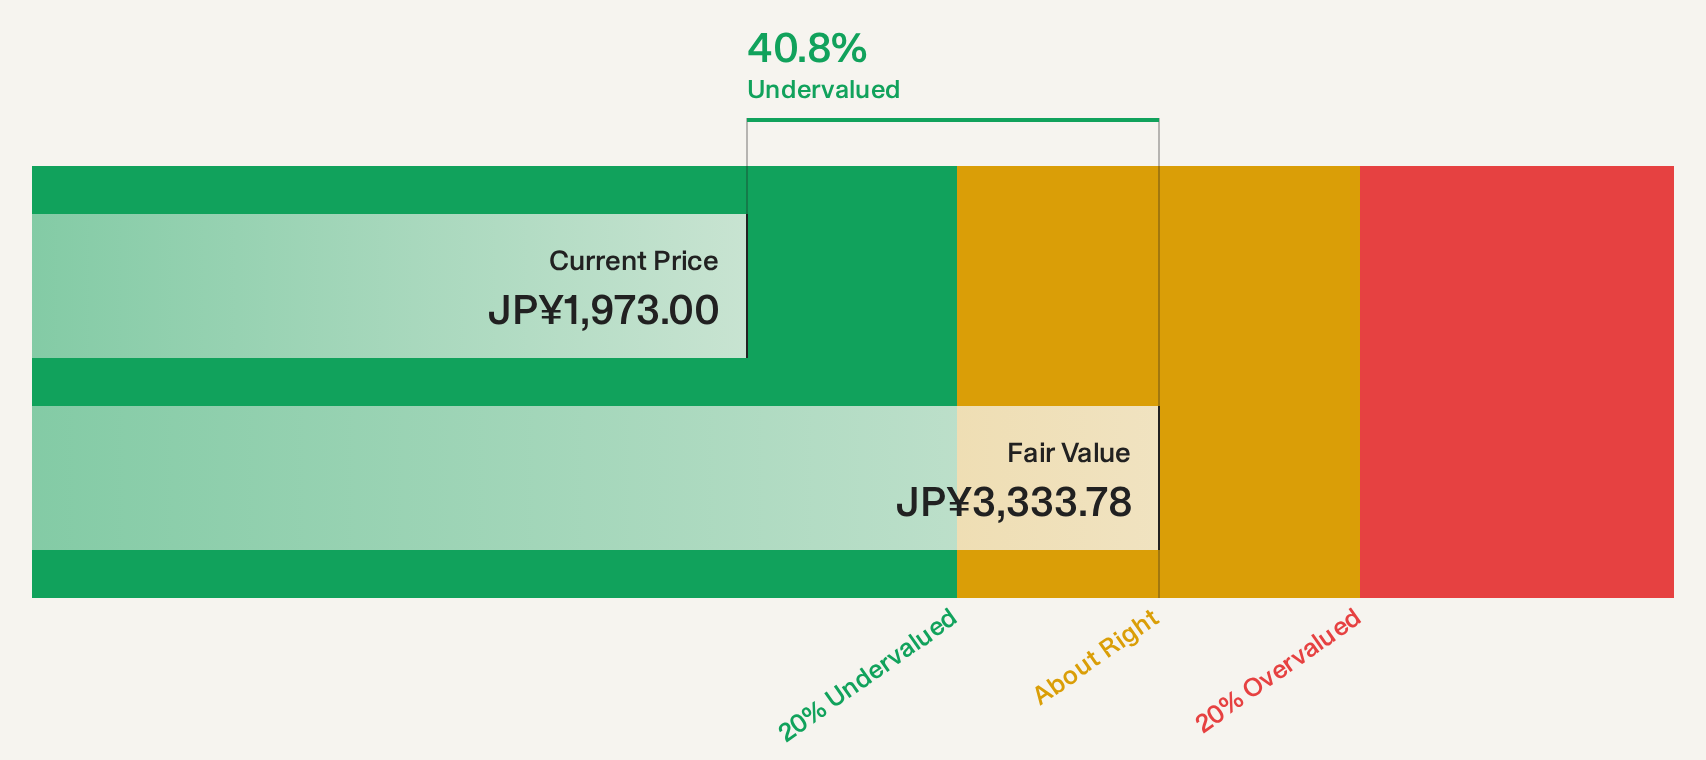
Estimated Discount To Fair Value: 39.9%
Elecom is trading at ¥2,000, considerably below its estimated future cash flow value of ¥3,326.23 and 39.9% under its fair value estimate. Despite a recent earnings increase of 120.6%, the company faces declining forecasted earnings by 8.2% annually over the next three years and slower revenue growth (4.6%) compared to the Japanese market average (6.9%). The dividend track record remains unstable, and future Return on Equity is projected to be low at 11.1%.
- Upon reviewing our latest growth report, Elecom's projected financial performance appears quite optimistic.
- Navigate through the intricacies of Elecom with our comprehensive financial health report here.
TOKAI (TSE:9729)
Overview: TOKAI Corp. offers a range of healthy life services in Japan and has a market cap of ¥78.76 billion.
Operations: The company's revenue segments include healthy life services in Japan, contributing ¥78.76 billion to its market capitalization.
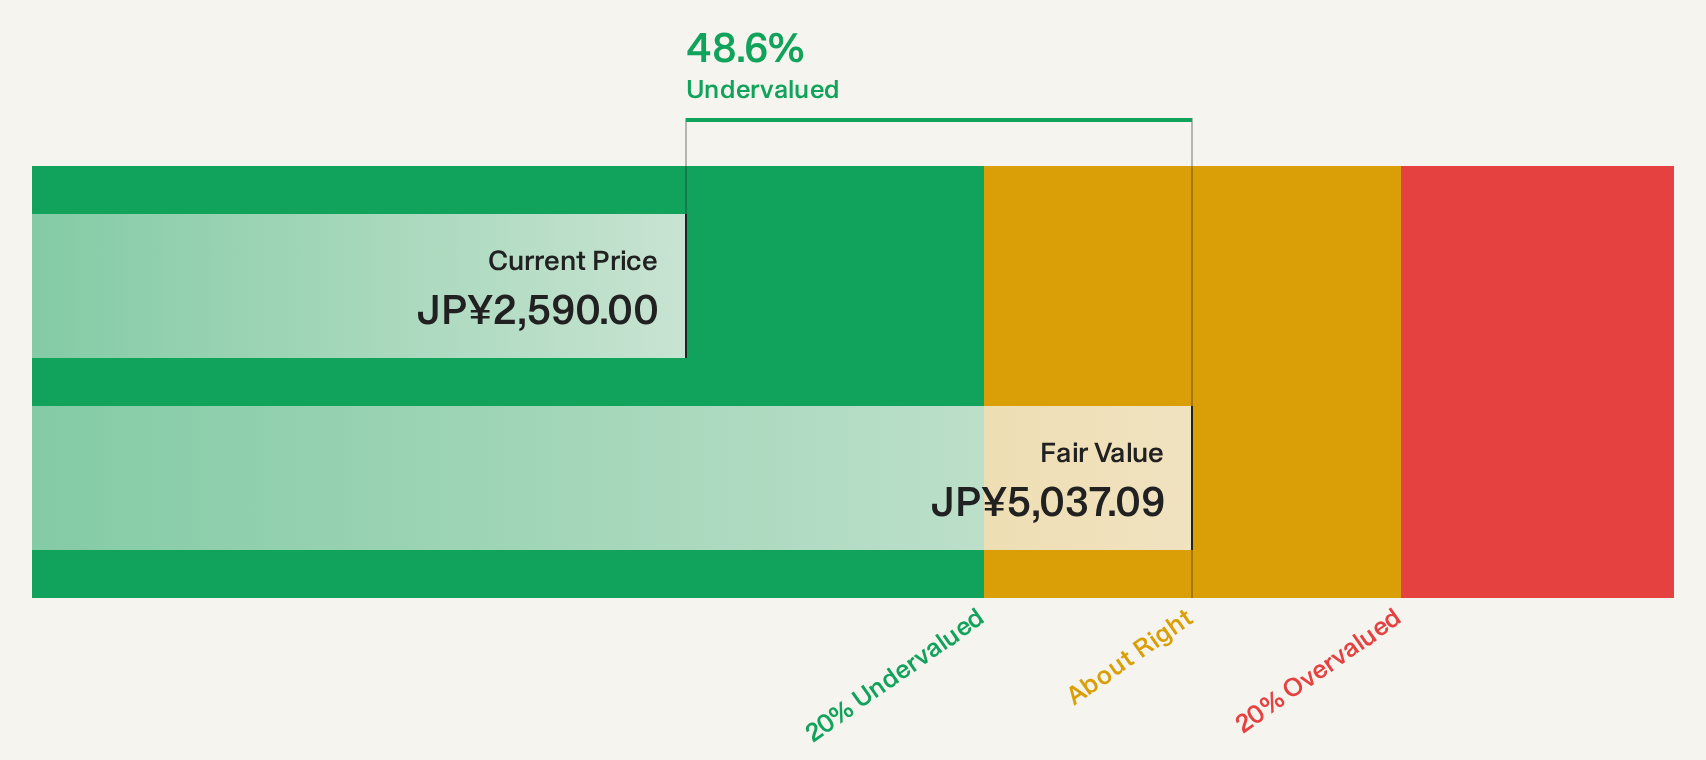
Estimated Discount To Fair Value: 49.4%
TOKAI is trading at ¥2,550, significantly below its estimated future cash flow value of ¥5,037.09 and 49.4% under its fair value estimate. While earnings grew by 41.3% last year, forecasted annual growth is modest at 4.06%, lagging behind the Japanese market average of 9.5%. Despite an unstable dividend history, recent guidance indicates increased dividends and projected net sales of ¥165.4 billion for fiscal year ending March 2027.
- Our earnings growth report unveils the potential for significant increases in TOKAI's future results.
- Delve into the full analysis health report here for a deeper understanding of TOKAI.
Turning Ideas Into Actions
- Delve into our full catalog of 169 Undervalued Asian Stocks Based On Cash Flows here.
- Hold shares in these firms? Setup your portfolio in Simply Wall St to seamlessly track your investments and receive personalized updates on your portfolio's performance.
- Streamline your investment strategy with Simply Wall St's app for free and benefit from extensive research on stocks across all corners of the world.
Ready To Venture Into Other Investment Styles?
- Explore high-performing small cap companies that haven't yet garnered significant analyst attention.
- Diversify your portfolio with solid dividend payers offering reliable income streams to weather potential market turbulence.
- Fuel your portfolio with companies showing strong growth potential, backed by optimistic outlooks both from analysts and management.
This article by Simply Wall St is general in nature. We provide commentary based on historical data and analyst forecasts only using an unbiased methodology and our articles are not intended to be financial advice. It does not constitute a recommendation to buy or sell any stock, and does not take account of your objectives, or your financial situation. We aim to bring you long-term focused analysis driven by fundamental data. Note that our analysis may not factor in the latest price-sensitive company announcements or qualitative material. Simply Wall St has no position in any stocks mentioned.
Have feedback on this article? Concerned about the content? Get in touch with us directly. Alternatively, email editorial-team@simplywallst.com