
- PRICING
- LIVE QUOTES
- LEARN
- HELP


EN
SECOM (TSE:9735) Just Drew Fresh Attention, What Is The Market Missing?
SECOM (TSE:9735) has just completed a share repurchase program that has been running since May, buying back 9,761,600 shares, or 2.43% of its stock, for ¥63,279.44 million.
SECOM’s recent buyback occurs in a mixed price backdrop, with the share price at ¥6,257 after a modest 7-day share price return of 1.02%, but a 90-day share price return that has declined 6.61%.
Compare SECOM’s buyback with peers by reviewing hand-picked security and industrial services stocks in the 22 resilient stocks with low risk scores list, which features companies with resilient balance sheets and steadier return profiles.
SECOM has just taken a sizeable chunk of its own shares off the market, while the price has drifted over the past quarter. Does that tilt the risk reward toward buyers at today’s valuation, or does it suggest that it is not yet the right time?
SECOM valuation check: are buybacks happening below fair value?
SECOM is retiring shares while the stock trades at ¥6,257, which sits about 13.8% below an internal fair value estimate of ¥7,260.98 based on future cash flows. That gap frames the whole buyback story, since retiring equity at a discount can be more accretive to remaining holders than doing so at or above estimated value.
The SWS DCF model arrives at that ¥7,260.98 figure by projecting SECOM’s expected cash flows and then discounting them back to today using a required return. It is essentially asking what those future yen are worth in present terms, given the time value of money and the risks tied to the business.
SECOM’s profile helps explain why a cash flow based view is being used as the benchmark. Earnings are forecast to grow 6.75% per year, which is described as positive but not significant, and both revenue and profit growth are expected to run slower than the wider Japanese market. In that sort of mid single digit growth setting, incremental buybacks and a 1.92% dividend can matter quite a bit for total return, especially if the shares are trading below a modelled fair value.
Investors now have a company that has shrunk its share count by 2.43%, is trading below an estimated cash flow value, and carries what is described as high quality earnings. Those who focus on valuation will likely weigh that against a relatively low 8.5% return on equity and funding that relies fully on higher risk borrowing sources rather than customer deposits.
Look into how the SWS DCF model arrives at its fair value.
Result: DCF Fair value of ¥7,260.98 (UNDERVALUED)
Still, SECOM faces clear risks if security demand weakens or if annual revenue and net income growth, near 4% and 6.75%, fail to support investor confidence.
Find out about the key risks to this SECOM narrative.
Another view on SECOM’s valuation
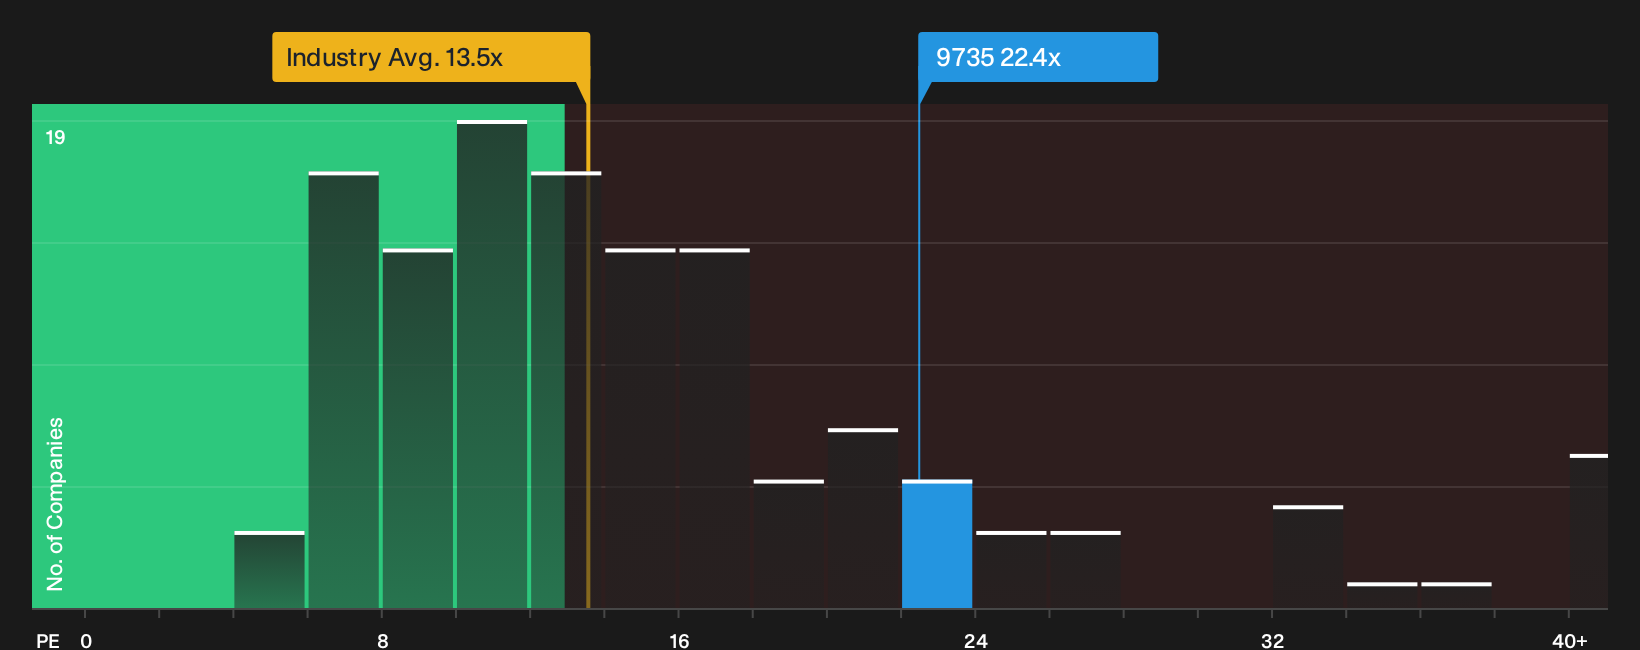
A different lens tells a less generous story. SECOM trades on a P/E of 22.4x, which is higher than the JP Commercial Services industry at 13.5x and above a peer average of 16.5x. The fair ratio sits at 23.7x, so the share price already leans toward that upper band. This raises the question of how much safety is really left for new buyers.
See what the numbers say about this price — find out in our valuation breakdown.
Simply Wall St performs a discounted cash flow (DCF) on every stock in the world every day (check out SECOM for example). We show the entire calculation in full. You can track the result in your watchlist or portfolio and be alerted when this changes, or use our stock screener to discover 15 high quality undervalued stocks. If you save a screener we even alert you when new companies match - so you never miss a potential opportunity.
Next Steps
Curious whether the caution or the optimism in this SECOM story should carry more weight for you personally? Move quickly, run the numbers yourself, then check how those figures line up with the 4 key rewards.
Looking for more SECOM sized investment ideas?
You have seen how SECOM stacks up. Now widen the lens and spot other opportunities that could suit your portfolio before the market moves without you.
- Target higher income potential by reviewing companies in the 28 dividend fortresses that pair substantial yields with balance sheets built to handle pressure.
- Hunt for mispriced quality by scanning the 15 high quality undervalued stocks where solid fundamentals and compressed valuations meet in one focused list.
- Strengthen your downside protection by working through the list of solid balance sheet and fundamentals (23 results) and focusing on businesses with sturdier financial footing.
This article by Simply Wall St is general in nature. We provide commentary based on historical data and analyst forecasts only using an unbiased methodology and our articles are not intended to be financial advice. It does not constitute a recommendation to buy or sell any stock, and does not take account of your objectives, or your financial situation. We aim to bring you long-term focused analysis driven by fundamental data. Note that our analysis may not factor in the latest price-sensitive company announcements or qualitative material. Simply Wall St has no position in any stocks mentioned.
Have feedback on this article? Concerned about the content? Get in touch with us directly. Alternatively, email editorial-team@simplywallst.com