
- PRICING
- LIVE QUOTES
- LEARN
- HELP


EN
What’s Behind Sempra (SRE) Stock’s Latest Move?
Sempra (SRE) is back on screens after a recent move in the share price, with the stock closing at US$79.97. Investors are weighing this level against the utility's long term earnings profile.
The recent 2.3% one day share price gain sits against a weaker trend, with the 30 day share price return down 4.8% and the 90 day move down 16.1%. Sempra’s 5 year total shareholder return of 50.4% shows the longer term story has been more resilient than the recent pullback suggests.
Scan beyond Sempra and see how other regulated utilities are repricing after recent moves with our curated list of 31 resilient stocks with low risk scores
The pullback has put Sempra on many watchlists. Does it make more sense to start building a position here, or wait and hope for an even cheaper entry before the valuation work stacks up for you?
Most Popular Narrative: 21% Undervalued
On the latest narrative work, Sempra’s fair value of $101.59 sits well above the recent $79.97 close. This puts the recent share price slide in a different light for anyone weighing the risk and reward trade off.
The US$47.5b five year base capital plan at Oncor, along with US$10b of incremental identified projects tied to ERCOT endorsed upgrades, reliability work and future resiliency filings, keeps the earlier thesis about sustained capital deployment into transmission and distribution assets in place as a driver of long term earnings growth.
See why 26 investors see Sempra as 21% undervalued.
Result: Fair Value of $101.59 (UNDERVALUED)
Still, Sempra’s story can change quickly if regulators tighten allowed returns in California or Texas, or if LNG construction setbacks drag on earnings longer than expected.
Find out about the key risks to this Sempra narrative.
Another View On Sempra’s Valuation
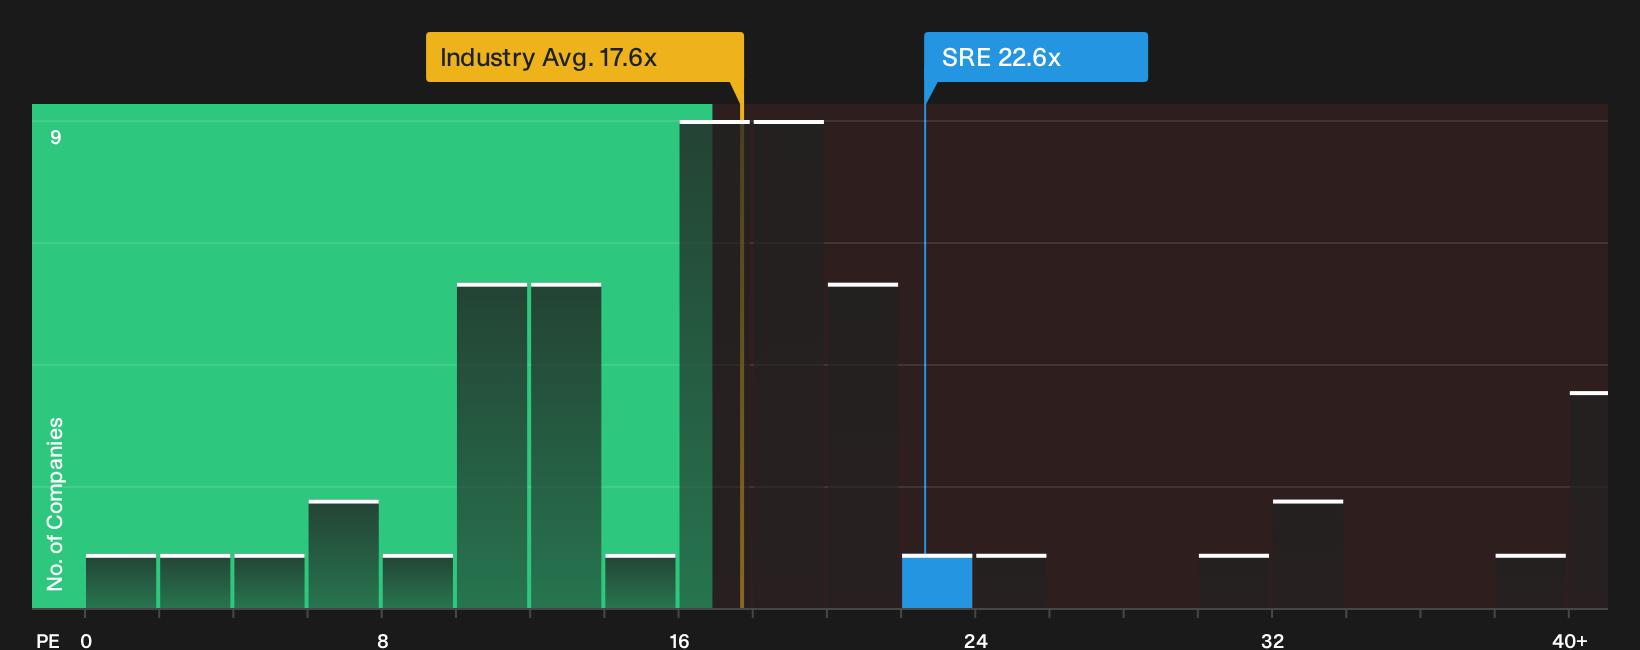
Those analyst fair value estimates suggest upside, yet Sempra’s current P/E of 23.1x tells a different story. The stock trades above the peer average of 19.2x and even above its own fair ratio of 22.4x. That premium signals valuation risk if earnings progress or sentiment wobble. Which signal do you give more weight to?
For a closer look at how this pricing gap lines up with earnings quality and sector norms, See what the numbers say about this price — find out in our valuation breakdown.
Next Steps
Mixed messages on Sempra’s valuation and risk profile can be confusing. Move quickly, test the numbers yourself, and weigh the 2 key rewards and 2 important warning signs.
Looking for more Sempra sized investment ideas?
You have weighed Sempra’s setup. Now widen the opportunity set and let the data surface fresh candidates that match your risk and return preferences.
- Target potential mispricings by scanning a curated pool of 27 high quality undervalued stocks that pair quality fundamentals with market skepticism.
- Build a steadier income stream by reviewing a focused group of 8 dividend fortresses that prioritize payouts alongside financial resilience.
- Strengthen your watchlist by zeroing in on a list of solid balance sheet and fundamentals (25 results) that can better absorb shocks when conditions get uncomfortable.
This article by Simply Wall St is general in nature. We provide commentary based on historical data and analyst forecasts only using an unbiased methodology and our articles are not intended to be financial advice. It does not constitute a recommendation to buy or sell any stock, and does not take account of your objectives, or your financial situation. We aim to bring you long-term focused analysis driven by fundamental data. Note that our analysis may not factor in the latest price-sensitive company announcements or qualitative material. Simply Wall St has no position in any stocks mentioned.
Have feedback on this article? Concerned about the content? Get in touch with us directly. Alternatively, email editorial-team@simplywallst.com