
- PRICING
- LIVE QUOTES
- LEARN
- HELP


EN
Mosaic (MOS) Stock Could Trade Below Fair Value As Shares Fell 42%
Mosaic shares have fallen sharply over recent years, which puts fresh attention on whether the current market value lines up with what the fertilizer producer is actually generating in sales. For investors watching a stock that has struggled, the live question is how well Mosaic's share price today reflects the revenue power of its business.
- Over the past 5 years the stock has fallen 42.4%. This raises the issue of whether the market is now asking too much or too little for each dollar of Mosaic's sales.
- The company's earnings are closely tied to fertilizer pricing and agricultural demand. As a result, the pricing power and stability of those end markets can shape how much investors are prepared to pay for its current and future revenue base.
- There is a second opinion on Mosaic worth weighing. See what analysts think Mosaic's shares could be worth.
The issue now is whether Mosaic's current share price is justified by its sales when set against the Fair Ratio benchmark.
If Mosaic's 42.4% share price decline over 5 years has you rethinking where you start your research, it can help to cross check ideas against a focused screen such as 27 high quality undervalued stocks.
Is Mosaic a Bargain on Sales?
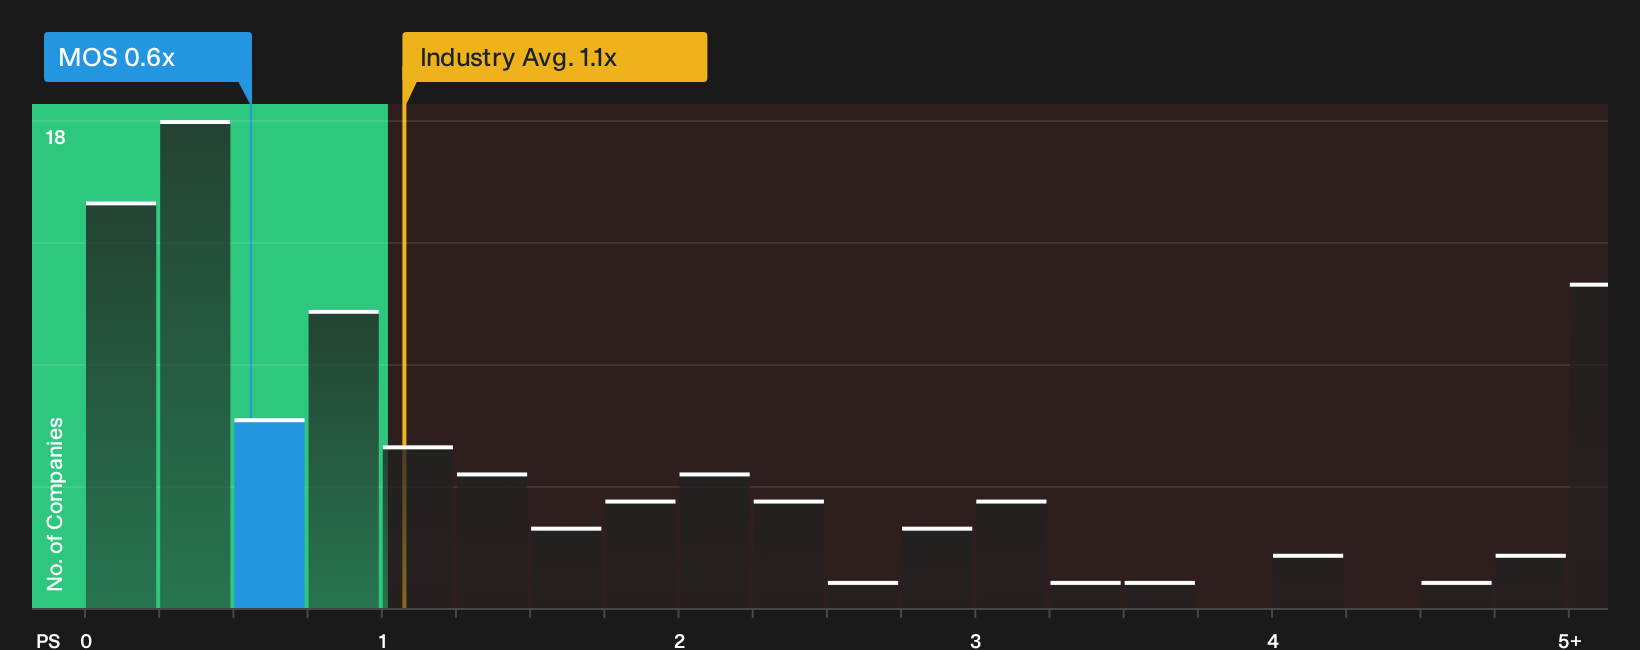
P/S fits Mosaic because investors often focus on revenue when earnings swing with commodity pricing. On this yardstick, the stock trades on a P/S of about 0.6x, which is much lower than the chemicals industry average of roughly 1.1x and also below the peer group at around 1.1x.
The Fair Ratio model, which adjusts the P/S benchmark for Mosaic's size, profitability profile and sector risks, points to a higher multiple than the one the market is currently paying. That gap suggests the shares screen as undervalued against the revenue based yardstick implied by the Fair Ratio. For readers weighing Mosaic, the key question is whether the quality and resilience of its sales justify closing any part of that spread. Explore the numbers behind Mosaic's P/S valuation.
The Mosaic Narrative: What Would Justify Today's Price?
Simply Wall St Narratives pick up where Mosaic's valuation puzzle leaves off by spelling out which paths for growth, profitability and earnings would need to play out for the stock to be worth materially more or less than it trades for today, using the Community page as the home base for that discussion. Rather than a single multiple or model output, each one spells out the key assumptions behind its view of fair value so you can compare those inputs with Mosaic's reported results over time.
Bullish and bearish Mosaic investors are looking at the same phosphate and sulfur story and drawing very different conclusions about what the current price already reflects.
Bull case: 20% undervalued
"Reallocation of capital away from lower return assets such as Araxa, Patrocinio and the Carlsbad mine toward businesses like Mosaic Biosciences and rare earth element extraction projects is expected to shift the mix toward higher margin profit pools…"
Discover why this Narrative puts Mosaic at 20% undervalued.
Bear case: 19% overvalued
"Although tight global phosphate supply and elevated DAP minus raw material margins currently support Mosaic’s realized pricing, prolonged sulfur availability and affordability constraints that have already taken Louisiana offline and left other U.S. and Brazilian phosphate assets heavily curtailed could lock in structurally higher conversion and idle costs…"
Explore why this Narrative puts Mosaic at 19% overvalued.
One more Mosaic question before you move on
Before acting on where Mosaic trades today, it helps to see how professionals are modeling the business a few years out and compare that picture with the current pricing. Explore where analysts expect Mosaic to be in a few years.
This article by Simply Wall St is general in nature. We provide commentary based on historical data and analyst forecasts only using an unbiased methodology and our articles are not intended to be financial advice. It does not constitute a recommendation to buy or sell any stock, and does not take account of your objectives, or your financial situation. We aim to bring you long-term focused analysis driven by fundamental data. Note that our analysis may not factor in the latest price-sensitive company announcements or qualitative material. Simply Wall St has no position in any stocks mentioned.
Have feedback on this article? Concerned about the content? Get in touch with us directly. Alternatively, email editorial-team@simplywallst.com