
- PRICING
- LIVE QUOTES
- LEARN
- HELP


EN
3 Global Stocks That May Be Trading Below Their Estimated Value In October 2026
As global markets navigate a landscape marked by mixed U.S. job growth, persistent inflation, and fluctuating Treasury yields, investors are keenly observing the potential impacts on stock valuations worldwide. In this environment of economic uncertainty and shifting monetary policies, identifying stocks that may be trading below their estimated value can present opportunities for those looking to capitalize on market inefficiencies.
Top 10 Undervalued Stocks Based On Cash Flows
| Name | Current Price | Fair Value (Est) | Discount (Est) |
| XTB (WSE:XTB) | PLN134.80 | PLN269.03 | 49.9% |
| Shanghai Flyco Electrical Appliance (SHSE:603868) | CN¥31.09 | CN¥61.58 | 49.5% |
| Riken Technos (TSE:4220) | ¥2420.00 | ¥4817.14 | 49.8% |
| Prologue (ENXTPA:ALPRG) | €0.284 | €0.56 | 49.5% |
| Orthex Oyj (HLSE:ORTHEX) | €4.41 | €8.78 | 49.8% |
| Innodisk (TPEX:5289) | NT$1270.00 | NT$2525.51 | 49.7% |
| Hainan Jinpan Smart Technology (SHSE:688676) | CN¥61.53 | CN¥121.93 | 49.5% |
| Grupa Pracuj (WSE:GPP) | PLN55.80 | PLN110.49 | 49.5% |
| ENN Energy Holdings (SEHK:2688) | HK$48.70 | HK$96.84 | 49.7% |
| BuySell TechnologiesLtd (TSE:7685) | ¥2810.00 | ¥5564.19 | 49.5% |
Here we highlight a subset of our preferred stocks from the screener.
NOF (TSE:4403)
Overview: NOF Corporation is a Japanese company that manufactures chemicals, with a market cap of approximately ¥565.87 billion.
Operations: The company's revenue is primarily derived from its Functional Chemicals segment at ¥153.25 billion, followed by Explosives & Propulsion at ¥73.92 billion, and Pharmaceuticals, Medicals and Health at ¥48.68 billion.
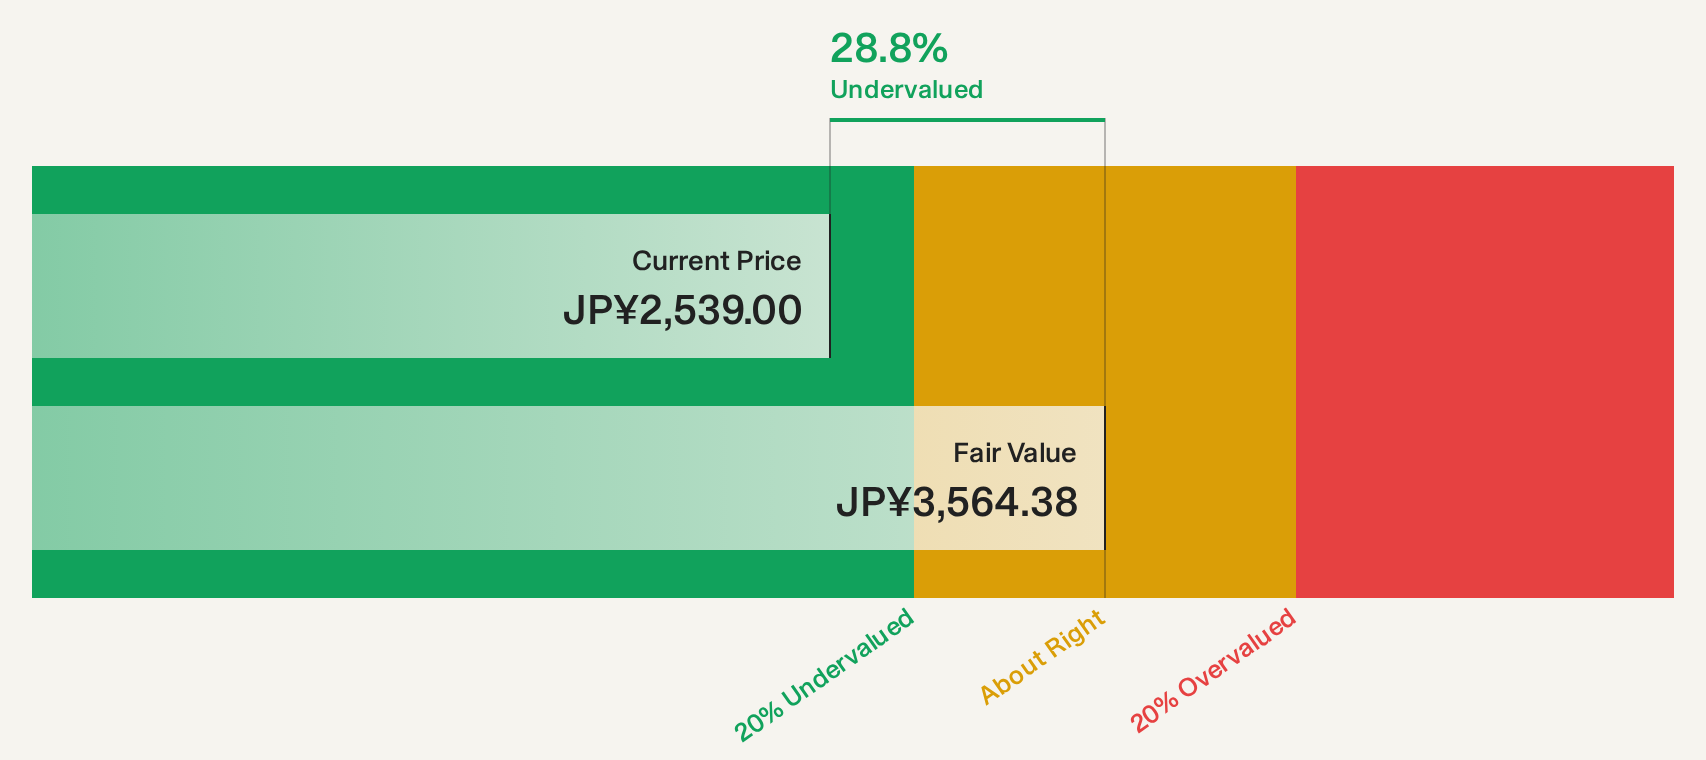
Estimated Discount To Fair Value: 28.4%
NOF is trading at ¥2,556, significantly below its estimated future cash flow value of ¥3,570.3. Analysts agree on a potential 41.6% price increase, highlighting undervaluation. Despite modest earnings growth forecasts and a low future return on equity (14.7%), NOF maintains a reliable 2.74% dividend yield and recently completed a share buyback worth ¥4,999.95 million to enhance capital efficiency and shareholder returns amidst stable revenue projections for the fiscal year ending March 2027.
- According our earnings growth report, there's an indication that NOF might be ready to expand.
- Unlock comprehensive insights into our analysis of NOF stock in this financial health report.
Sumitomo Mitsui Trust Group (TSE:8309)
Overview: Sumitomo Mitsui Trust Group, Inc. operates as a trust bank both in Japan and internationally, with a market capitalization of approximately ¥4.83 trillion.
Operations: The company generates revenue through its core operations as a trust bank, serving clients both domestically and globally.
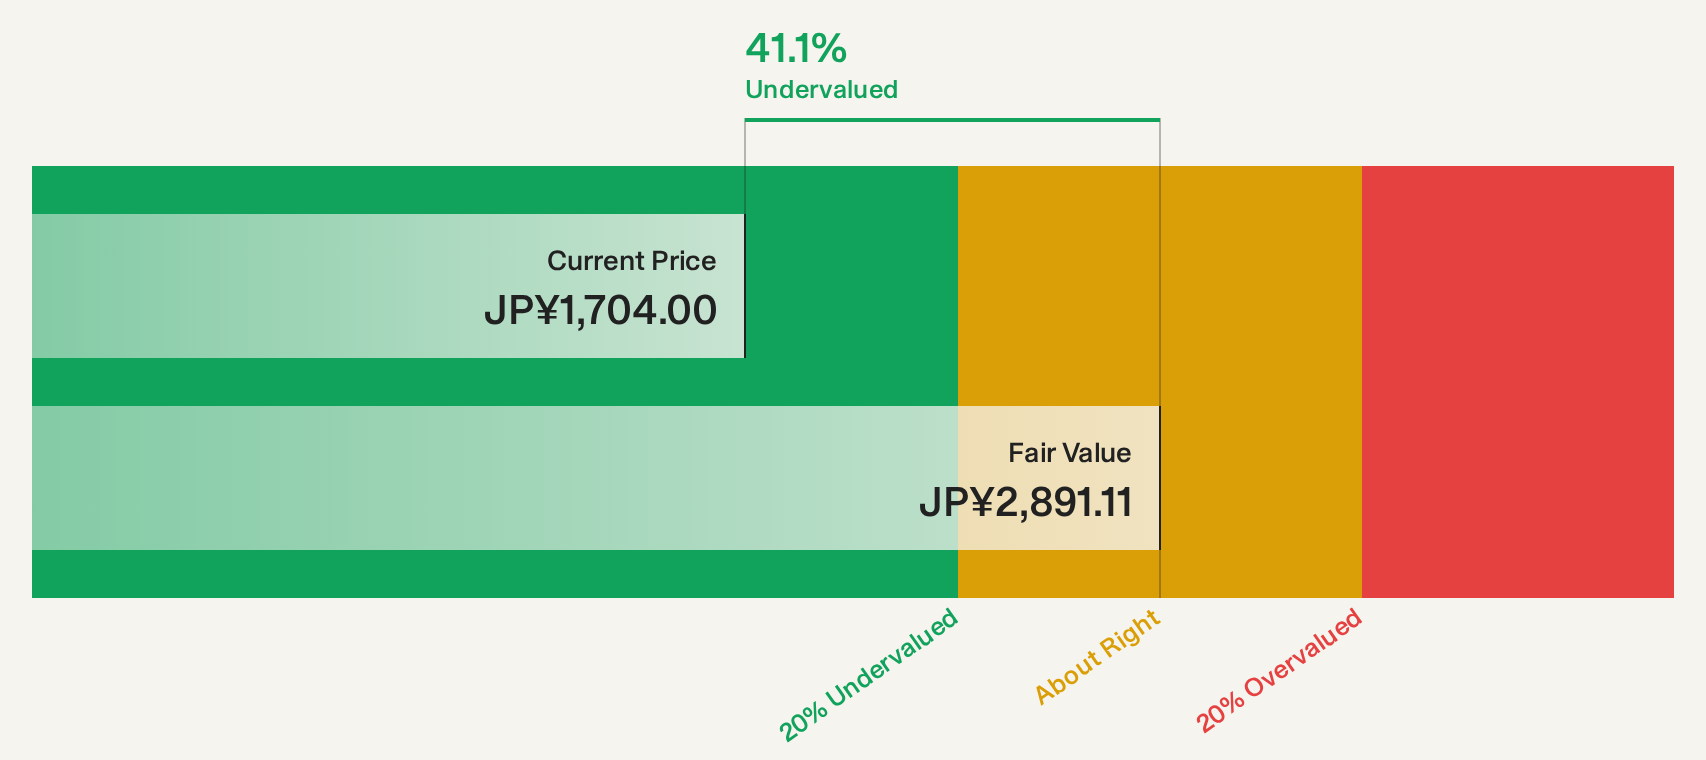
Estimated Discount To Fair Value: 39.8%
Sumitomo Mitsui Trust Group is trading at ¥1,789.5, significantly below its estimated future cash flow value of ¥2,973.16. Despite a forecasted revenue decline of 6.1% annually over the next three years and modest earnings growth expectations of 3.6% per year, the stock remains undervalued based on discounted cash flow analysis by over 20%. Recent fixed-income offerings totaling ¥50 billion may bolster financial flexibility amidst these challenges while maintaining a reliable dividend yield of 2.65%.
- The analysis detailed in our Sumitomo Mitsui Trust Group growth report hints at robust future financial performance.
- Delve into the full analysis health report here for a deeper understanding of Sumitomo Mitsui Trust Group.
Suruga Bank (TSE:8358)
Overview: Suruga Bank Ltd. offers a range of banking and financial products and services to both individual and corporate clients in Japan, with a market cap of ¥496.46 billion.
Operations: The company generates revenue primarily from its banking segment, which amounts to ¥112.07 billion.
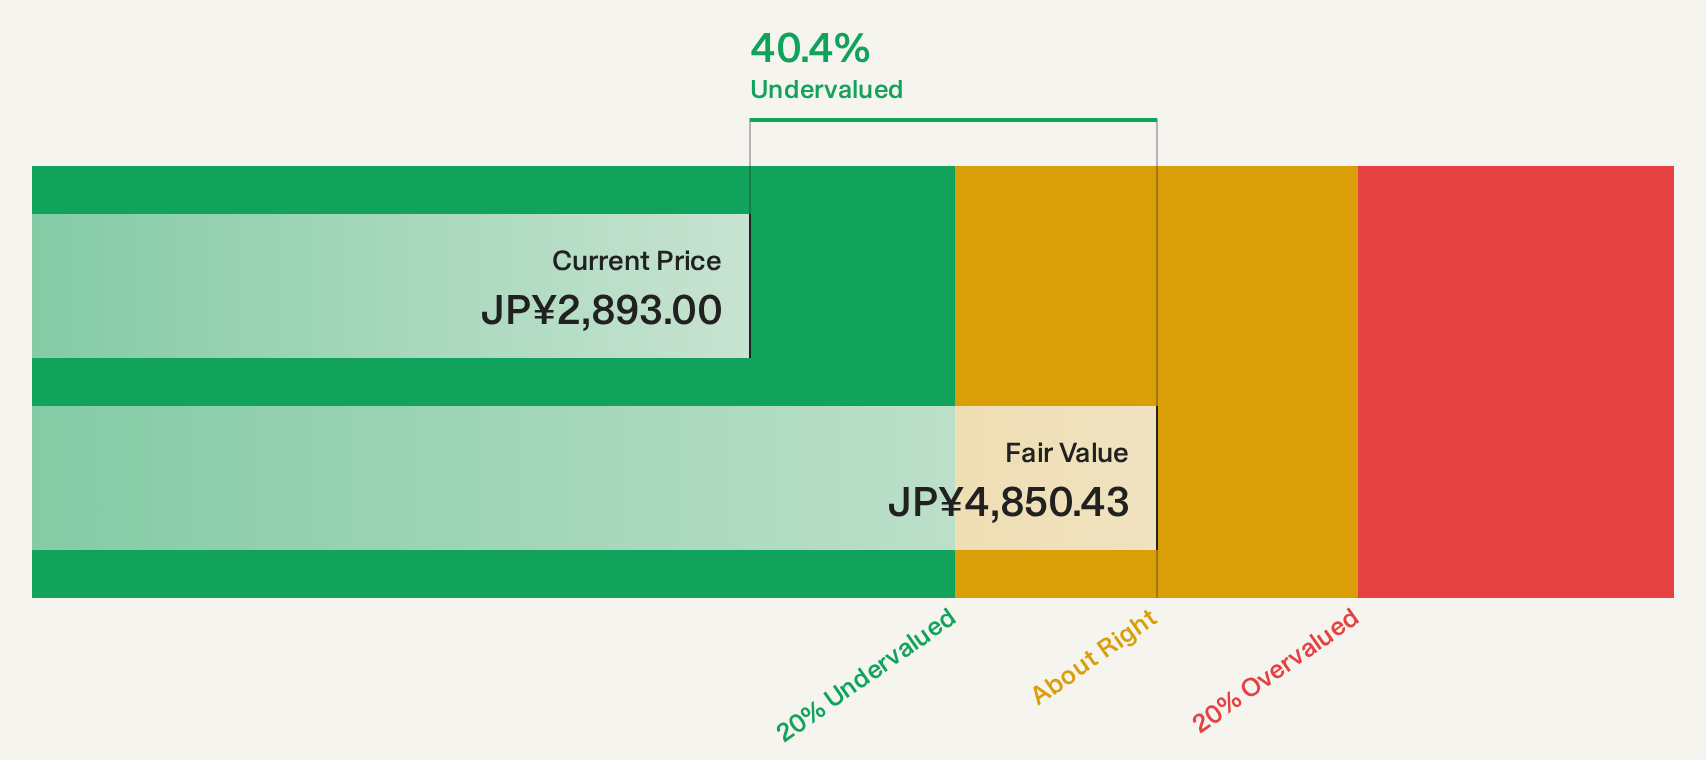
Estimated Discount To Fair Value: 39.1%
Suruga Bank is trading at ¥3,040, well below its estimated future cash flow value of ¥4,988.09, indicating significant undervaluation. Despite a high level of bad loans at 5.5% and forecasts for earnings to decline by 0.9% annually over the next three years, recent buybacks totaling ¥6.46 billion may enhance shareholder value. The bank's earnings surged by 130.5% in the past year, although revenue growth remains modest at 1.1% annually.
- Our earnings growth report unveils the potential for significant increases in Suruga Bank's future results.
- Dive into the specifics of Suruga Bank here with our thorough financial health report.
Taking Advantage
- Gain an insight into the universe of 230 Undervalued Global Stocks Based On Cash Flows by clicking here.
- Shareholder in one or more of these companies? Ensure you're never caught off-guard by adding your portfolio in Simply Wall St for timely alerts on significant stock developments.
- Unlock the power of informed investing with Simply Wall St, your free guide to navigating stock markets worldwide.
Looking For Alternative Opportunities?
- Explore high-performing small cap companies that haven't yet garnered significant analyst attention.
- Diversify your portfolio with solid dividend payers offering reliable income streams to weather potential market turbulence.
- Fuel your portfolio with companies showing strong growth potential, backed by optimistic outlooks both from analysts and management.
This article by Simply Wall St is general in nature. We provide commentary based on historical data and analyst forecasts only using an unbiased methodology and our articles are not intended to be financial advice. It does not constitute a recommendation to buy or sell any stock, and does not take account of your objectives, or your financial situation. We aim to bring you long-term focused analysis driven by fundamental data. Note that our analysis may not factor in the latest price-sensitive company announcements or qualitative material. Simply Wall St has no position in any stocks mentioned.
Have feedback on this article? Concerned about the content? Get in touch with us directly. Alternatively, email editorial-team@simplywallst.com