
- PRICING
- LIVE QUOTES
- LEARN
- HELP


EN
Synchrony Financial (SYF) Stock May Be Undervalued On Earnings Power
Synchrony Financial has delivered a powerful 3 year share price run, and the recent pullback now has investors asking whether the current valuation is still backed by its earnings power. With the stock at US$71.88 after a softer year to date, the core question is whether the underlying profit engine justifies where the market is pricing it today.
- A roughly 160.2% gain over the past 3 years puts a lot of accumulated optimism into Synchrony Financial, so the issue is whether its earnings profile has kept pace with that move.
- The business leans heavily on consumer credit and interest income, so loan performance, funding costs and credit losses can all feed directly into how much sustainable profit its earnings stream can support.
- The analysts covering Synchrony Financial have run their own numbers. See what analysts think Synchrony Financial's shares could be worth.
The stock's next move may depend on whether today's price for Synchrony Financial lines up with what its earnings suggest is reasonable.
If you want more ideas alongside Synchrony Financial while you weigh earnings against price, a focused screener of 27 high quality undervalued stocks can be a useful next research step.
Is Synchrony Financial Still Cheap on Earnings?
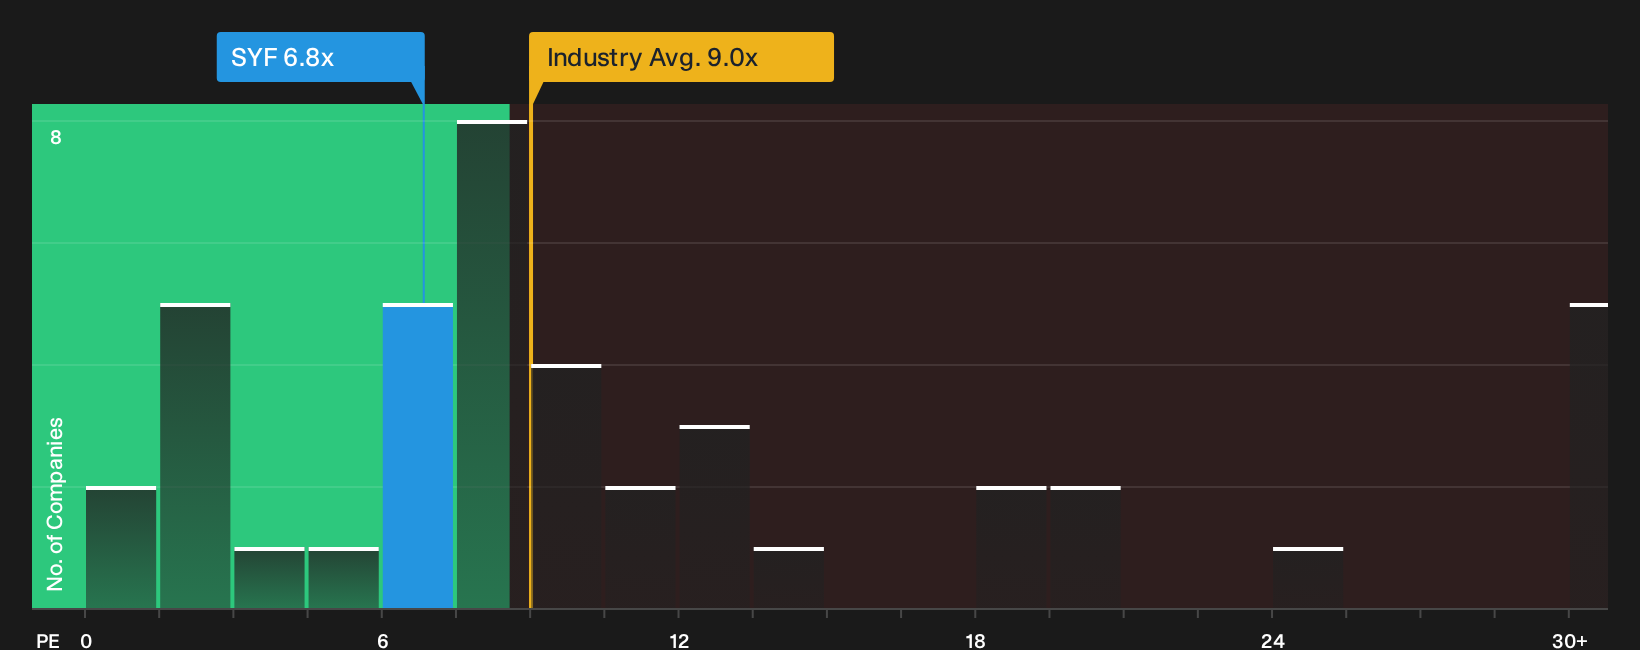
The P/E ratio fits Synchrony Financial because earnings remain the main yardstick for a lender that lives on interest income and credit performance. On that yardstick, the stock trades at about 6.8x earnings, which is below the Consumer Finance industry average of roughly 9.0x and also below the broader peer group near 18.0x. For a reader comparing options in the same space, that gap indicates that the market is pricing Synchrony at a lower earnings multiple than many competitors.
A fair P/E level that takes into account Synchrony Financial’s own profitability profile, balance sheet strength and risk mix would be higher than where the shares trade today. The current 6.8x multiple is therefore below what this more tailored benchmark suggests, so the market price implies a discount relative to the earnings level the model identifies as reasonable. For anyone weighing whether the pullback has reset expectations enough, the size of that gap is where the valuation debate now sits. Explore the numbers behind Synchrony Financial's P/E valuation.
The Synchrony Financial Narrative: What Would Justify Today's Price?
Narratives for Synchrony Financial pick up where the P/E debate leaves off, by spelling out which paths for future growth, margins and earnings would need to play out for the current share price to look either stretched or conservative. Instead of one number from a ratio or model, they map the future that number relies on so you can see what needs to occur and check over time whether those conditions stay in place.
One of the top community narratives on Synchrony Financial: 32% undervalued
"Your DCF/Excess Return analysis suggests Synchrony Financial’s intrinsic value is around $145 per share, meaning the stock could be trading at a steep discount…"
Discover why this Narrative puts Synchrony Financial at 32% undervalued.
One More Thing About Synchrony Financial That Deserves Your Attention
There is a separate set of checks on Synchrony Financial that does not show up in a simple P/E chart, and those flags can change how you weigh everything you just read. Take a closer look at 2 warning signs (1 major) before settling on a valuation.
This article by Simply Wall St is general in nature. We provide commentary based on historical data and analyst forecasts only using an unbiased methodology and our articles are not intended to be financial advice. It does not constitute a recommendation to buy or sell any stock, and does not take account of your objectives, or your financial situation. We aim to bring you long-term focused analysis driven by fundamental data. Note that our analysis may not factor in the latest price-sensitive company announcements or qualitative material. Simply Wall St has no position in any stocks mentioned.
Have feedback on this article? Concerned about the content? Get in touch with us directly. Alternatively, email editorial-team@simplywallst.com