
- PRICING
- LIVE QUOTES
- LEARN
- HELP


EN
Why Berkshire Hathaway (BRK.B) Is Getting Attention Today
Recent share performance and size of Berkshire Hathaway
Berkshire Hathaway (BRK.B) has moved only modestly in recent trading, with a 0.3% gain over the past day and a 0.2% rise across the past week, while the past month shows a 0.3% decline.
The conglomerate carries significant scale, with a market value of about US$1.08b and a recent share price of US$504.26 as of 1 October 2026.
Recent trading suggests Berkshire Hathaway’s momentum is softening in the near term, with a modest 1-year total shareholder return of 0.85%. However, the 3-year total shareholder return of 45.97% indicates that longer-horizon investors have seen far more meaningful gains.
Spot 19 high quality undiscovered gems that share Berkshire Hathaway’s diversified strengths but are still flying under most investors’ radar.Bulls point to Berkshire Hathaway’s scale, value score and long term returns. Bears flag the softer recent move and pressure on net income. Which side does the current valuation actually support?
Price-to-earnings of 12.6x: Is it justified for Berkshire Hathaway?
Berkshire Hathaway trades on a P/E of 12.6x, while the last close was $504.26, and several checks suggest the market may be assigning a lower earnings multiple than its history and peers might imply.
The P/E ratio compares the current share price with earnings per share and gives a quick sense of how much investors are paying for each dollar of profit. For a broad conglomerate like Berkshire Hathaway, which spans insurance, rail, energy and manufacturing, the P/E often reflects how dependable those earnings are and how confident the market is that they can be sustained.
On Simply Wall St’s checks, Berkshire Hathaway is described as good value on several fronts. The stock is assessed as trading at good value compared to peers and the wider diversified financials group. Its P/E of 12.6x is below the US Diversified Financial industry average of 16.6x. It is also below the peer average of 22.4x and under the estimated fair P/E of 14.8x that the fair ratio model suggests. That combination points to a level the market could move towards if sentiment or earnings stability were viewed more in line with those reference points.
Explore the SWS fair ratio for Berkshire Hathaway.
Result: Price-to-earnings of 12.6x (UNDERVALUED)
Still, Berkshire Hathaway faces pressure from declining annual net income growth of 8.35% and softer recent returns, which could cap enthusiasm if those trends persist.
Find out about the key risks to this Berkshire Hathaway narrative.
Another view on Berkshire Hathaway’s value
The earlier P/E check suggests Berkshire Hathaway looks inexpensive, yet the SWS DCF model presents an even stronger picture. On that approach, the estimated future cash flow value is $794.98 per share, compared with the current $504.26 level. This comparison implies the stock screens as undervalued. The key question is whether those long term cash flow assumptions feel realistic to you.
Look into how the SWS DCF model arrives at its fair value.
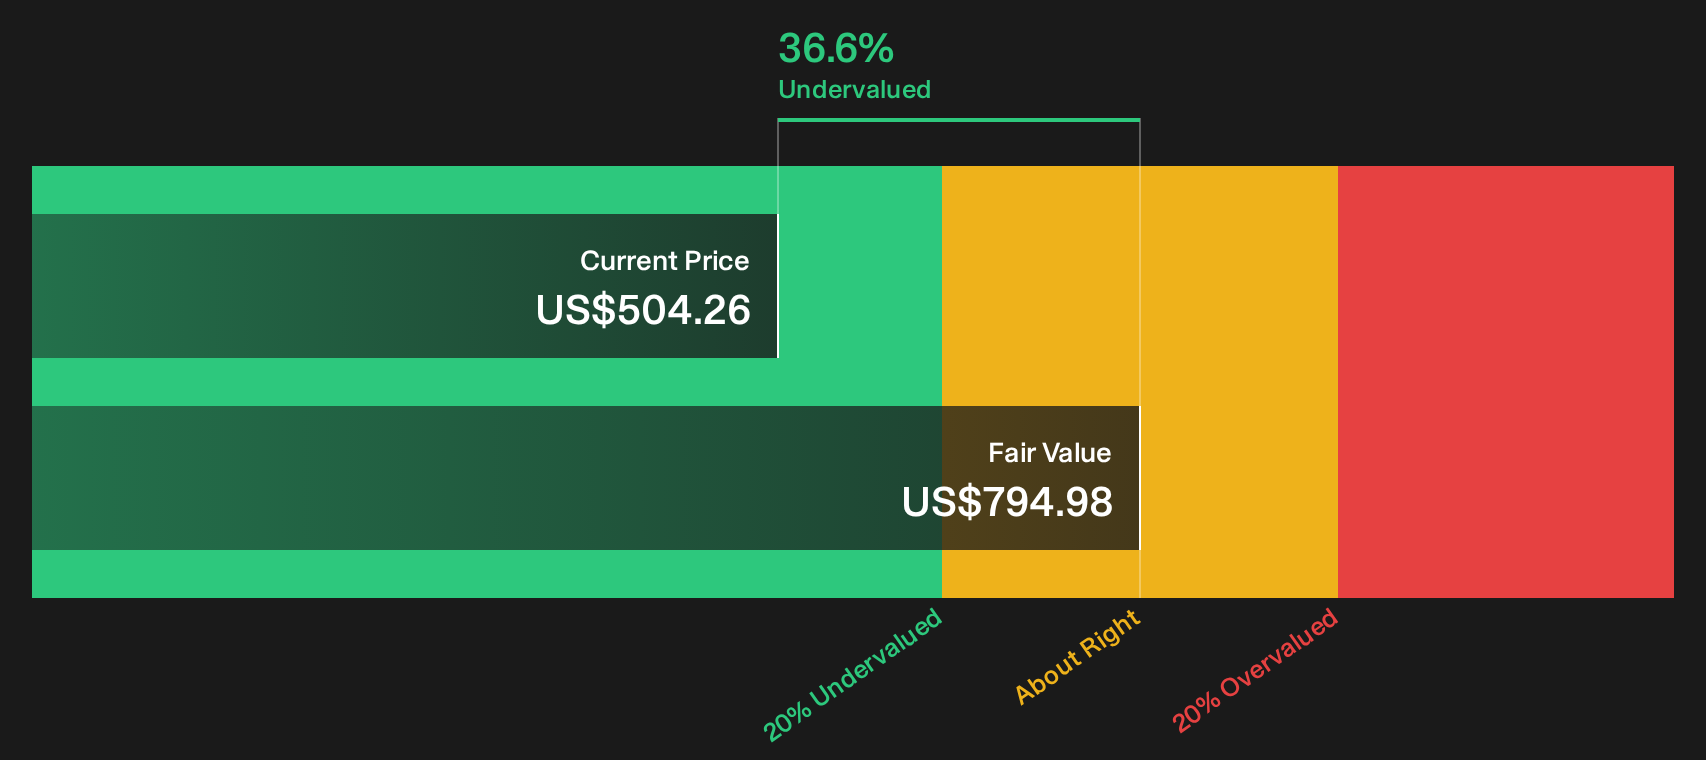
Simply Wall St performs a discounted cash flow (DCF) on every stock in the world every day (check out Berkshire Hathaway for example). We show the entire calculation in full. You can track the result in your watchlist or portfolio and be alerted when this changes, or use our stock screener to discover 27 high quality undervalued stocks. If you save a screener we even alert you when new companies match - so you never miss a potential opportunity.
Next Steps
Mixed messages on Berkshire Hathaway’s valuation and risk reward profile make this a judgment call. Move quickly to review the numbers, pressure points and potential upsides yourself, then weigh the 3 key rewards and 1 important warning sign
Looking for more Berkshire Hathaway style investment ideas?
If Berkshire Hathaway has you thinking harder about pricing, risk and quality, it makes sense to line up a few more candidates before the next move.
- Zero in on stronger income potential by reviewing stocks that our high yield filter highlights as resilient income options through the 7 dividend fortresses.
- Sharpen your watchlist with companies our valuation filters flag as attractively priced using the 27 high quality undervalued stocks.
- Stack the odds toward sturdier balance sheets and steadier fundamentals by scanning the list of solid balance sheet and fundamentals (25 results) before the crowd catches on.
This article by Simply Wall St is general in nature. We provide commentary based on historical data and analyst forecasts only using an unbiased methodology and our articles are not intended to be financial advice. It does not constitute a recommendation to buy or sell any stock, and does not take account of your objectives, or your financial situation. We aim to bring you long-term focused analysis driven by fundamental data. Note that our analysis may not factor in the latest price-sensitive company announcements or qualitative material. Simply Wall St has no position in any stocks mentioned.
Have feedback on this article? Concerned about the content? Get in touch with us directly. Alternatively, email editorial-team@simplywallst.com