
- PRICING
- LIVE QUOTES
- LEARN
- HELP


EN
Uranium Royalty (UROY) Files A Shelf Registration, Is The Stock Overvalued?
Uranium Royalty Shelf Registration Sets Up Potential Capital Raise
Uranium Royalty (NasdaqCM:UROY) has filed a shelf registration for up to US$915.9m in common stock, covering 226,719,982 shares. This filing opens the door to future equity issuance and potential dilution.
Recent trading has been choppy for Uranium Royalty, with the share price at US$3.97 after a 1 day share price return of 2.32%, a 30 day share price return that is down 7.46%, and a 90 day share price return of 41.28% that points to building momentum, despite a 1 year total shareholder return that is down 7.24% and a 3 year total shareholder return of 25.24%.
Compare Uranium Royalty's capital raise backdrop with other nuclear focused plays and see which stocks screen best on balance sheet strength and fundamentals using our curated 19 nuclear energy infrastructure stocks
Uranium Royalty now trades only about 8% below the average analyst target, while a large shelf overhang lingers after a strong 90 day run. Is that a reasonable cushion or a warning sign?
Preferred Price-to-Earnings of 27.3x: Is It Justified?
Uranium Royalty now trades on a P/E of 27.3x, with the last close at $3.97, and that valuation puts the stock on a richer footing than the broader US Metals and Mining industry while still below its immediate peer group.
The P/E ratio compares the current share price with earnings per share and effectively tells you how much investors are willing to pay for each dollar of profit. For a royalty and uranium holding business like Uranium Royalty, this matters because earnings can be tied to contract structures and uranium exposure, rather than traditional mine operations.
A 27.3x P/E, combined with a low 5.1% return on equity and a value score of 1, suggests the market is paying a high price for each dollar of current earnings. The stock is expensive compared to the US Metals and Mining industry average P/E of 20.1x, although it screens cheaper than a peer average P/E of 32.1x. This may indicate investors are already building in richer expectations for some rivals while still pricing Uranium Royalty at a discount to that group level.
See what the numbers say about this price — find out in our valuation breakdown.
Result: Price-to-Earnings of 27.3x (OVERVALUED).
Still, Uranium Royalty faces the overhang of a sizeable shelf registration and the risk that fresh equity at weaker prices could quickly compress that P/E premium.
Find out about the key risks to this Uranium Royalty narrative.
Another View on Uranium Royalty Valuation
The P/E argument already points to Uranium Royalty looking expensive. The SWS DCF model goes even further, with an estimated future cash flow value of $1.21 against a share price of $3.97. That gap implies the stock screens as overvalued on cash flows as well. Which signal should be treated as more important?
Look into how the SWS DCF model arrives at its fair value.
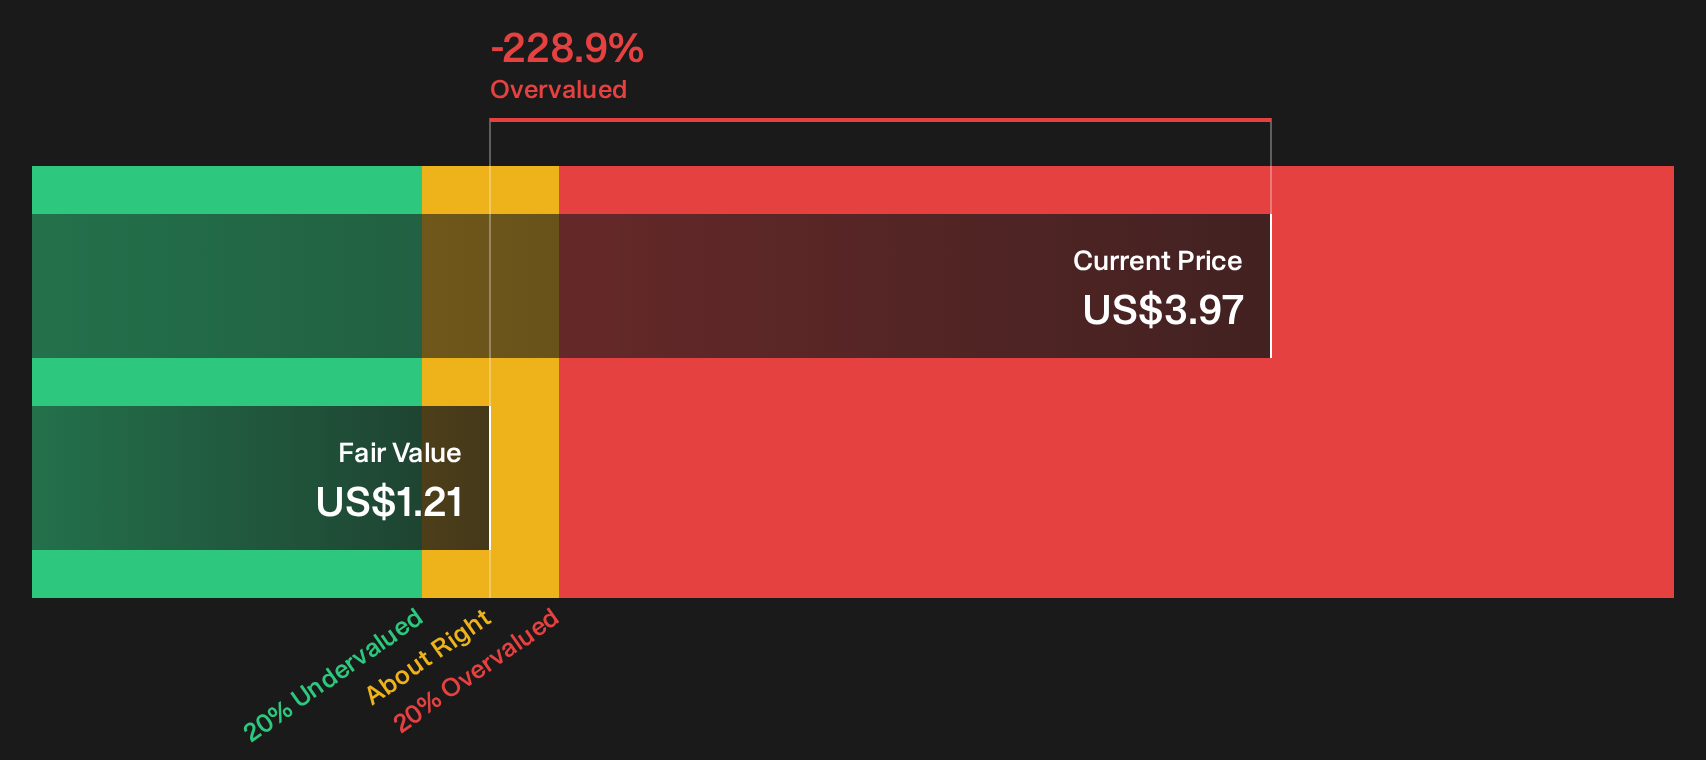
Simply Wall St performs a discounted cash flow (DCF) on every stock in the world every day (check out Uranium Royalty for example). We show the entire calculation in full. You can track the result in your watchlist or portfolio and be alerted when this changes, or use our stock screener to discover 31 high quality undervalued stocks. If you save a screener we even alert you when new companies match - so you never miss a potential opportunity.
Next Steps
Does Uranium Royalty really look as stretched as these valuation checks suggest, or is the risk reward mix more balanced than it appears at first glance? Act while the information is fresh, review the underlying data for yourself, and weigh both the potential upside and the concerns by starting with 1 key reward and 2 important warning signs
Looking for more Uranium Royalty investment ideas?
Once you have formed an opinion on Uranium Royalty, do not stop there. Broader context from other opportunities can sharpen your judgement and highlight what you might be missing.
- Spot potential mispricings by scanning a curated 31 high quality undervalued stocks that filters for quality businesses trading below their assessed worth.
- Build a more resilient portfolio by checking a 31 resilient stocks with low risk scores that focuses on companies with stronger risk profiles.
- Get ahead of the crowd by reviewing a 19 high quality undiscovered gems that highlights lesser known stocks with solid fundamentals before they are widely followed.
This article by Simply Wall St is general in nature. We provide commentary based on historical data and analyst forecasts only using an unbiased methodology and our articles are not intended to be financial advice. It does not constitute a recommendation to buy or sell any stock, and does not take account of your objectives, or your financial situation. We aim to bring you long-term focused analysis driven by fundamental data. Note that our analysis may not factor in the latest price-sensitive company announcements or qualitative material. Simply Wall St has no position in any stocks mentioned.
Have feedback on this article? Concerned about the content? Get in touch with us directly. Alternatively, email editorial-team@simplywallst.com