
- PRICING
- LIVE QUOTES
- LEARN
- HELP


EN
NSD (TSE:9759) Could Be 21% Undervalued On Raised Earnings And Dividend Guidance
NSD (TSE:9759) just raised its earnings and dividend guidance, and paired that with an update on its ongoing share buyback. For investors, all three signals relate directly to shareholder returns.
Recent buying interest has picked up, with a 15.66% 90 day share price return and a 3.10% 30 day share price return, even though the year to date share price return is down 12.36% and the 1 year total shareholder return has declined 8.08%. NSD’s upgraded guidance and richer dividend outlook appear to be rebuilding momentum after a softer patch.
Scan other shareholder-friendly opportunities that are moving on upgraded guidance and richer payouts with a curated set of 24 dividend fortresses.
NSD now pairs raised guidance, a richer dividend and an active buyback with a long track record in core IT services. The real issue is whether that combination is already fully reflected in today’s price.
Preferred P/E of 16.9x on NSD: Is it justified?
On valuation, NSD trades on a P/E of 16.9x, which sits below both its own estimated fair P/E of 18.4x and the current share price of ¥2,980.5 that the market is using to price its earnings power.
The P/E ratio compares the share price with earnings per share. For NSD, this matters because the business is profitable, has high quality earnings according to the data, and operates in a sector where investors often look closely at earnings-based measures when judging what they are willing to pay.
The current P/E of 16.9x is presented as good value when set against the estimated fair P/E of 18.4x. This comparison indicates that the multiple might move closer to the fair value estimate if sentiment and fundamentals remain aligned. At the same time, the stock is described as slightly expensive relative to the JP IT industry average P/E of 16.5x. The gap to peers is small, so the more prominent valuation focus is the comparison with the estimated fair ratio rather than the sector spread.
Explore the SWS fair ratio for NSD.
Result: Price-to-Earnings of 16.9x (UNDERVALUED)
Still, this hinges on NSD continuing to win work in core Japanese IT markets and avoiding any slowdown in earnings that would challenge the richer payout story.
Find out about the key risks to this NSD narrative.
Another view on NSD’s value
The SWS DCF model points in the same direction as the earnings multiple, with NSD trading at ¥2,980.5 compared with an estimated future cash flow value of ¥3,748.49, or about 20.5% below that mark. If both earnings and cash flow suggest that the shares may be undervalued, how comfortable are you with the assumptions behind them?
Look into how the SWS DCF model arrives at its fair value.
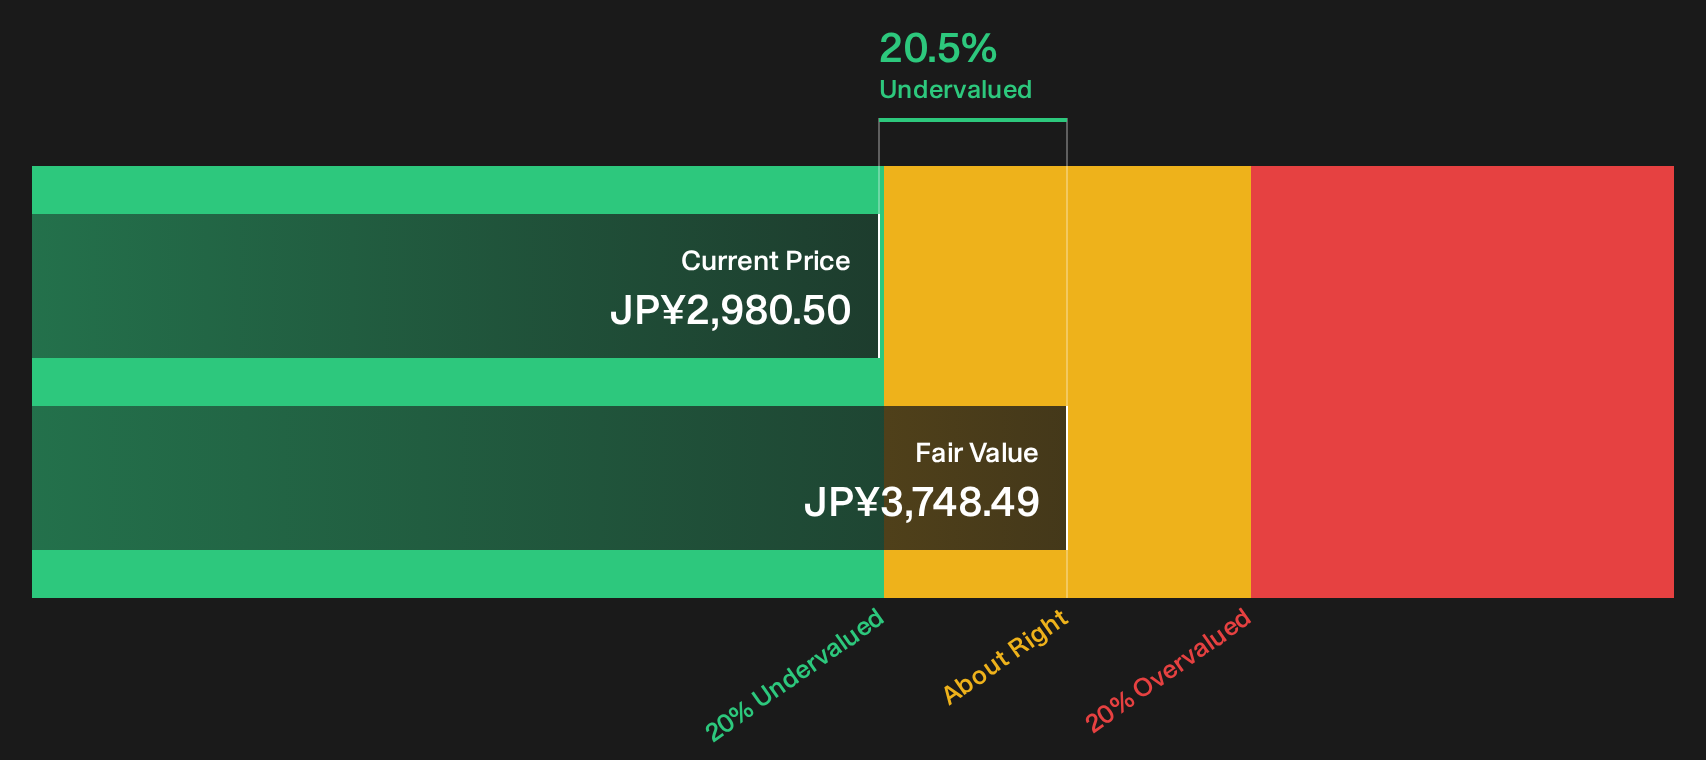
Simply Wall St performs a discounted cash flow (DCF) on every stock in the world every day (check out NSD for example). We show the entire calculation in full. You can track the result in your watchlist or portfolio and be alerted when this changes, or use our stock screener to discover 18 high quality undervalued stocks. If you save a screener we even alert you when new companies match - so you never miss a potential opportunity.
Next Steps
Optimistic about how NSD stacks up so far, or still on the fence and thinking this could go either way as fresh data lands? Take a few minutes to review the key positives that have investors interested and weigh them against your own risk tolerance with 4 key rewards.
Looking for more ideas beyond NSD?
If NSD has sharpened your focus on valuation and income, do not stop here. Broader idea hunting can sharpen your overall portfolio decisions.
- Target potential upside by scanning a curated pool of quality opportunities that screen as attractively priced through 18 high quality undervalued stocks.
- Prioritise resilience by zeroing in on companies with stronger finances using the focused list of solid balance sheet and fundamentals (23 results).
- Get ahead of the crowd by tracking a handpicked set of under-the-radar opportunities with 75 high quality undiscovered gems.
This article by Simply Wall St is general in nature. We provide commentary based on historical data and analyst forecasts only using an unbiased methodology and our articles are not intended to be financial advice. It does not constitute a recommendation to buy or sell any stock, and does not take account of your objectives, or your financial situation. We aim to bring you long-term focused analysis driven by fundamental data. Note that our analysis may not factor in the latest price-sensitive company announcements or qualitative material. Simply Wall St has no position in any stocks mentioned.
Have feedback on this article? Concerned about the content? Get in touch with us directly. Alternatively, email editorial-team@simplywallst.com