
- PRICING
- LIVE QUOTES
- LEARN
- HELP


EN
YIT Oyj (HLSE:YIT) Lands New Contracts, Is The Rally Already Above Fair Value?
YIT Oyj (HLSE:YIT) just added a new piece to its long-term project pipeline. A €70 million life cycle contract in Tuusula ties the builder to decades of design, construction and maintenance work.
The fresh Tuusula life cycle deal lands at a moment when momentum around YIT Oyj has been building, with a 31.23% 1 month share price return, a 60.37% 3 month share price return, and a 115.27% 3 year total shareholder return.
Spot similar momentum and contract-driven stories by scanning our curated 616 high quality undiscovered gems, which pairs strong fundamentals with growing project pipelines across global markets.YIT Oyj has a busy order book and a share price that has moved hard in a short span. Is this mainly project-driven progress showing up, or sentiment running ahead of what the construction group is currently worth?
Most Popular Narrative: 26% Overvalued
On the most followed narrative, YIT Oyj screens as overvalued, with a fair value of €3.48 against a last close of €4.37. As a result, the recent rally looks richer than the underlying model suggests.
Given the current share price of €4.28, the analyst price target of €3.48 is 22.8% lower. Despite analysts expecting the underlying business to improve, they seem to believe the market's expectations are too high.
See why 5 investors see YIT Oyj as 26% overvalued.
Result: Fair Value of €3.48 (OVERVALUED)
Still, that story can crack if Finland's weak housing market lingers, or if YIT Oyj's €670 million net debt and 84% gearing choke financial flexibility.
Find out about the key risks to this YIT Oyj narrative.
Another View on YIT Oyj's Value
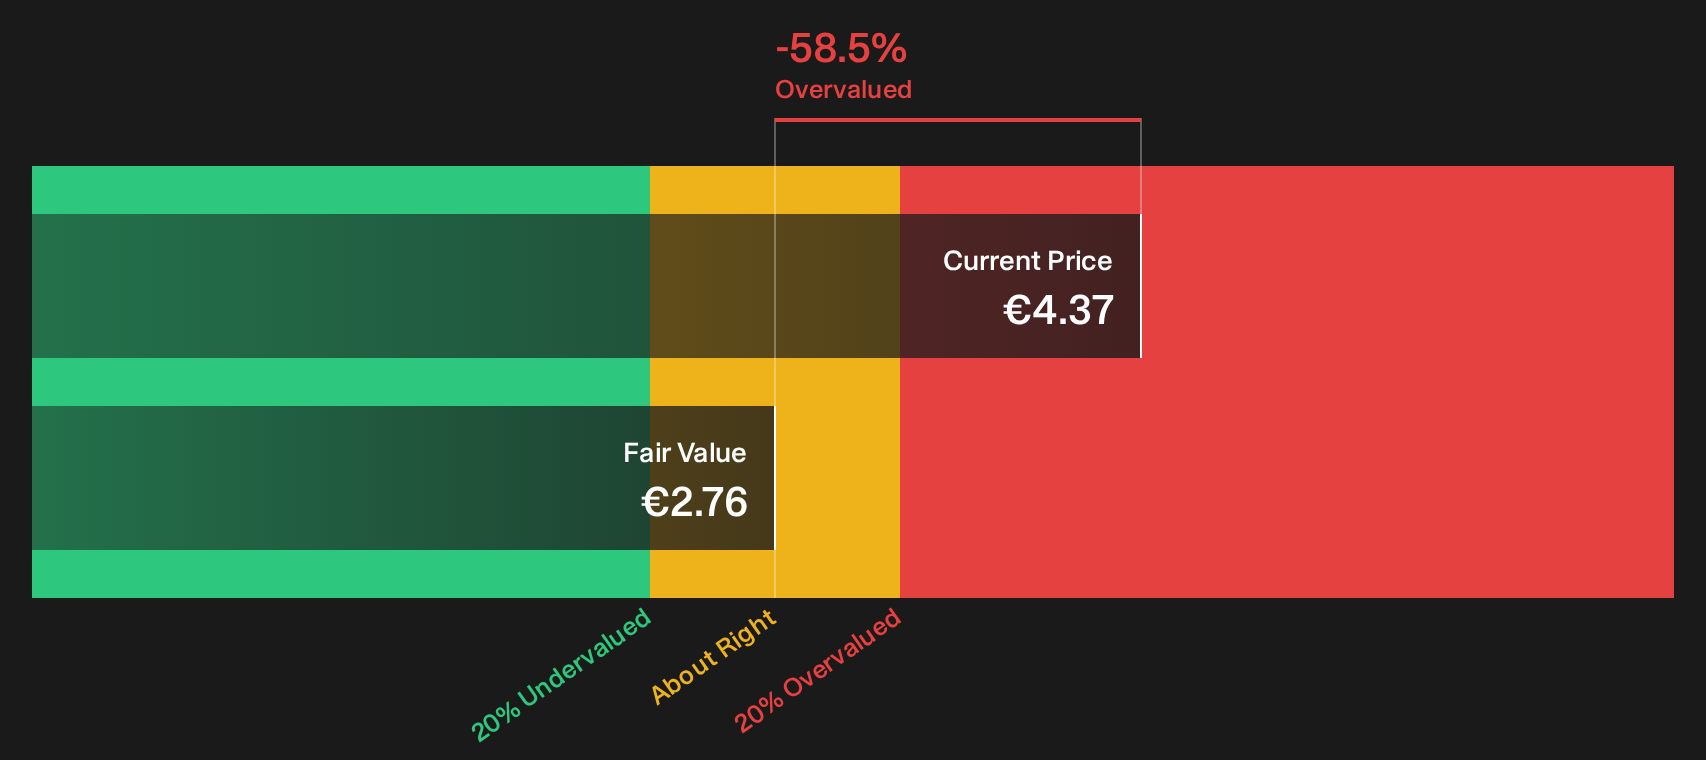
There is a twist when shifting from analyst targets to the SWS DCF model. Through that lens, YIT Oyj screens as overvalued, with a cash-flow-based fair value of €2.76 compared with the current €4.37. So if earnings forecasts slip, how much conviction would you still have in today’s price?
Look into how the SWS DCF model arrives at its fair value.
Next Steps
Plenty in this YIT Oyj story points both ways, with clear risks and clear potential rewards, so move fast, review the data yourself and weigh the 2 key rewards and 1 important warning sign.
Looking for more investment ideas beyond YIT Oyj?
Do not stop with one construction story. Use the Simply Wall Street Screener to compare different angles, diversify your watchlist and sharpen your sense of value.
- Target resilient compounding potential by scanning a 169 dividend fortresses that focuses on higher yields with an emphasis on durability and income consistency.
- Hunt for mispriced quality by checking a 196 high quality undervalued stocks that blends strong fundamentals with share prices that sit below internal valuation models.
- Spot financially robust operators by reviewing a list of solid balance sheet and fundamentals (208 results) that highlights cleaner balance sheets and sturdier fundamentals than the wider market.
This article by Simply Wall St is general in nature. We provide commentary based on historical data and analyst forecasts only using an unbiased methodology and our articles are not intended to be financial advice. It does not constitute a recommendation to buy or sell any stock, and does not take account of your objectives, or your financial situation. We aim to bring you long-term focused analysis driven by fundamental data. Note that our analysis may not factor in the latest price-sensitive company announcements or qualitative material. Simply Wall St has no position in any stocks mentioned.
Have feedback on this article? Concerned about the content? Get in touch with us directly. Alternatively, email editorial-team@simplywallst.com