
- PRICING
- LIVE QUOTES
- LEARN
- HELP


EN
CK Infrastructure Holdings (SEHK:1038) Could Be Fully Valued On Its Strong 3 Year Run
CK Infrastructure Holdings (SEHK:1038) has drawn fresh attention after a strong multi year share price run. This now puts valuation and earnings sustainability in sharp focus for investors assessing the recent move.
Recent trading has cooled a little, with the share price down 0.6% over the past week, even after a 7.3% 90 day share price return. CK Infrastructure Holdings still shows powerful long run momentum, with a 3 year total shareholder return of 105.5% that far outpaces its shorter term moves.
Compare CK Infrastructure Holdings' run with a curated set of other resilient infrastructure and utilities businesses by scanning our 228 resilient stocks with low risk scores.
CK Infrastructure Holdings looks like a solid infrastructure platform on the surface. After such a strong run, the real question is whether that quality is already fully reflected in today’s HK$64.9 share price.
Price-to-Earnings of 6.5x: Is It Justified For CK Infrastructure Holdings?
CK Infrastructure Holdings trades on a P/E of 6.5x, which sits below both the Hong Kong market average and the typical multiples seen across its direct peers. That low headline number raises the question of whether investors are underpaying for its earnings or correctly adjusting for the risks flagged in the recent results.
The P/E ratio compares the current share price with earnings per share. For a regulated utility style infrastructure group like CK Infrastructure Holdings, this yardstick often reflects how confident the market is that profits and cash generation can be maintained over time.
On the supportive side, CK Infrastructure Holdings screens as "good value" on this metric when stacked up against the Hong Kong market P/E of 10.7x, the Asian electric utilities sector at 14.2x, and a peer average of 15.7x. That is a wide gap. At the same time, the fair P/E estimate for the stock sits at 5.3x, which is lower than the current 6.5x. That signals the market may already be assigning a richer multiple than the level suggested by this fair ratio, particularly given forecasts for earnings and revenue to decline over the next three years and a dividend that is not well covered by free cash flows.
Explore the SWS fair ratio for CK Infrastructure Holdings.
Result: Price-to-Earnings of 6.5x (OVERVALUED)
Still, the sharp annual declines in revenue and net income, along with a dividend that lacks strong free cash flow cover, could quickly challenge the current CK Infrastructure Holdings valuation story.
Find out about the key risks to this CK Infrastructure Holdings narrative.
Another View On CK Infrastructure Holdings Using Our DCF Model
The SWS DCF model paints a very different picture for CK Infrastructure Holdings. In this view, the HK$64.9 share price sits well above an estimated future cash flow value of HK$13.38, which points to an overvalued reading instead of a cheap earnings multiple. Which signal do you trust more for long term decisions?
Look into how the SWS DCF model arrives at its fair value.
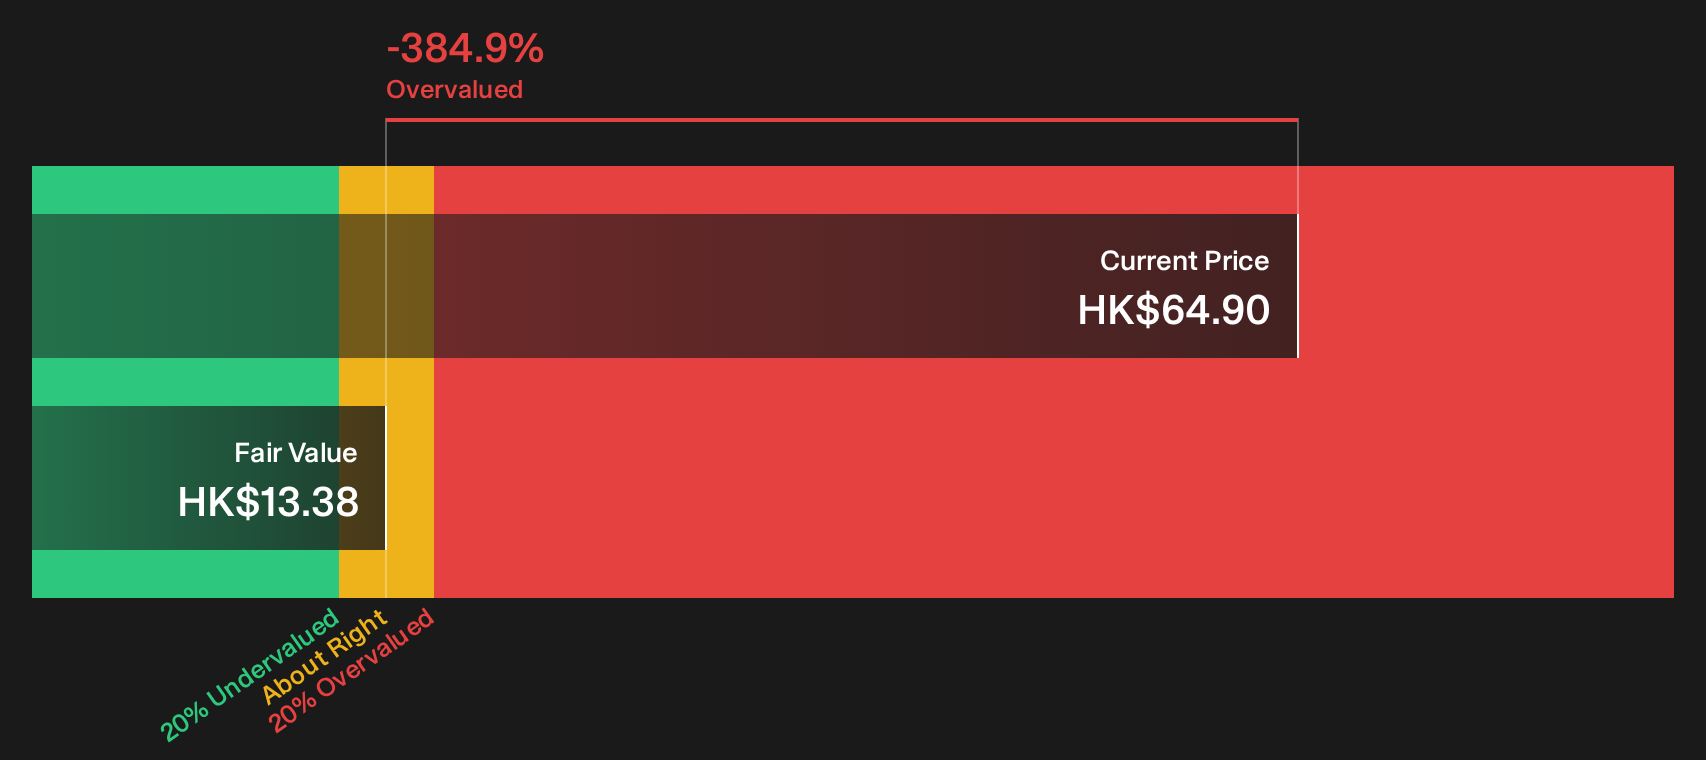
Simply Wall St performs a discounted cash flow (DCF) on every stock in the world every day (check out CK Infrastructure Holdings for example). We show the entire calculation in full. You can track the result in your watchlist or portfolio and be alerted when this changes, or use our stock screener to discover 196 high quality undervalued stocks. If you save a screener we even alert you when new companies match - so you never miss a potential opportunity.
Next Steps
Mixed messages on CK Infrastructure Holdings so far. If you want to move quickly and ground your own opinion in the data, start by weighing its 2 key rewards and 3 important warning signs.
Ready for more ideas beyond CK Infrastructure Holdings?
If CK Infrastructure Holdings has sharpened your focus on pricing and quality, you can use the Simply Wall St screener to quickly spot other opportunities that fit your checklist.
- Target stability first and hunt for resilient balance sheets and fundamentals across markets with our focused list of solid balance sheet and fundamentals (208 results).
- Zero in on potential value gaps by scanning companies that combine quality fundamentals with pricing that still looks reasonable through the 196 high quality undervalued stocks.
- Build your income shortlist by filtering for higher yielding opportunities with more robust profiles using the 169 dividend fortresses.
This article by Simply Wall St is general in nature. We provide commentary based on historical data and analyst forecasts only using an unbiased methodology and our articles are not intended to be financial advice. It does not constitute a recommendation to buy or sell any stock, and does not take account of your objectives, or your financial situation. We aim to bring you long-term focused analysis driven by fundamental data. Note that our analysis may not factor in the latest price-sensitive company announcements or qualitative material. Simply Wall St has no position in any stocks mentioned.
Have feedback on this article? Concerned about the content? Get in touch with us directly. Alternatively, email editorial-team@simplywallst.com