
- PRICING
- LIVE QUOTES
- LEARN
- HELP


EN
Is Apollo Global Management (APO) Undervalued As Daily Pricing Expands Across Its Credit Platform?
Apollo Global Management (APO) has expanded its Daily Pricing initiative across its roughly US$850b credit platform, giving more investors estimated day by day fair values on a wide range of private credit funds.
The latest Daily Pricing rollout comes at a softer moment for Apollo Global Management shares, with the 30 day share price return down 13.17% and the year to date share price return down 22.01%, even though the 5 year total shareholder return is 98.09%.
Scan how Apollo Global Management compares with other credit focused financials by running the curated list of solid balance sheet and fundamentals (25 results) that have held up on fundamentals even when share prices have come under pressure.
Apollo Global Management now trades well below both analyst targets and intrinsic value estimates, even as it pushes Daily Pricing deeper into its US$850b credit engine. Where does fair value really land inside that gap?
Preferred P/E of 35.8x for Apollo Global Management: Is it justified?
Apollo Global Management currently trades on a P/E of 35.8x, which sets a rich bar for a stock that has declined 8.6% on a total return basis over the past year.
P/E compares the share price with earnings per share, so a higher figure usually means investors are paying more today for each dollar of profit. For a diversified financial group such as Apollo Global Management, that ratio often reflects how much confidence the market has in the durability of fee income, performance revenues, and balance sheet risk.
The business has a mixed profile in the recent data. Earnings fell 45.4% over the past year and net profit margins are now 5.3%, down from 13.7%. Profits have grown 26.2% per year on average over the past five years. Analysts expect earnings to grow about 30.9% annually, compared with a broader US market forecast of 17.5% per year. That earnings outlook can help explain why investors are willing to accept a higher P/E, although the current ratio remains expensive relative to the estimated fair P/E of 23x and leaves less room for disappointment.
Compared with the wider US Diversified Financial industry, Apollo Global Management carries a P/E of 35.8x against an industry average of 16.6x, which is more than double and points to a steep premium. Even when stacked against its closer peer set, the stock looks cheaper than a 47.5x peer average. It still appears expensive versus the SWS fair P/E of 23x that the market could move toward if sentiment cools.
Explore the SWS fair ratio for Apollo Global Management.
Result: Price-to-earnings of 35.8x (OVERVALUED).
Still, Apollo Global Management faces clear risks if fee driven earnings disappoint or if private credit marks under Daily Pricing begin to challenge investor confidence.
Find out about the key risks to this Apollo Global Management narrative.
Another View On Apollo Global Management’s Value
While the P/E of 35.8x makes Apollo Global Management look expensive, the SWS DCF model points the other way. On that framework, APO at $114.34 trades below an estimated future cash flow value of $171.78, which frames the current quote as a potential discount to long term cash generation. Which lens would you lean on if the two stay this far apart?
Look into how the SWS DCF model arrives at its fair value.
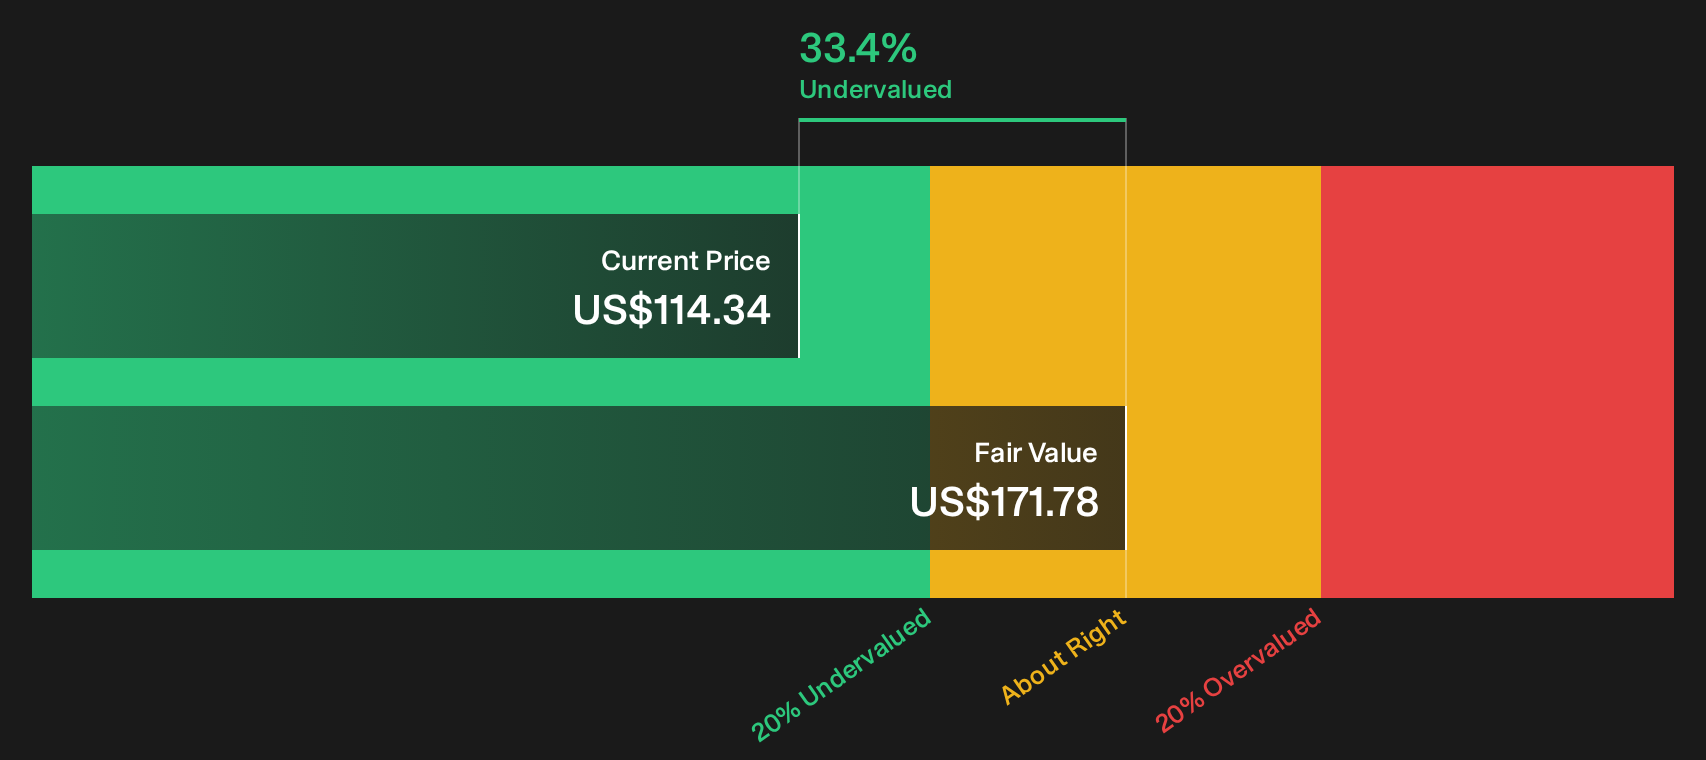
Simply Wall St performs a discounted cash flow (DCF) on every stock in the world every day (check out Apollo Global Management for example). We show the entire calculation in full. You can track the result in your watchlist or portfolio and be alerted when this changes, or use our stock screener to discover 28 high quality undervalued stocks. If you save a screener we even alert you when new companies match - so you never miss a potential opportunity.
Next Steps
Mixed signals around Apollo Global Management can make the picture feel muddled. Pressure test the numbers yourself, weigh the downside against the upside, and then lean on the 3 key rewards and 2 important warning signs.
Looking for more investment ideas beyond Apollo Global Management?
If Apollo Global Management has you rethinking what value looks like, do not stop here. Use the screeners below to pressure test fresh ideas before the crowd.
- Target quality at a discount and review the 28 high quality undervalued stocks to find companies that combine stronger fundamentals with pricing that has yet to catch up.
- Build a sturdier income stream and scan the 7 dividend fortresses to explore opportunities that focus on higher yields backed by robust financial profiles.
- Stack the odds in your favor and filter for resilience with the 31 resilient stocks with low risk scores to identify candidates that prioritize lower risk scores and steadier balance sheets.
This article by Simply Wall St is general in nature. We provide commentary based on historical data and analyst forecasts only using an unbiased methodology and our articles are not intended to be financial advice. It does not constitute a recommendation to buy or sell any stock, and does not take account of your objectives, or your financial situation. We aim to bring you long-term focused analysis driven by fundamental data. Note that our analysis may not factor in the latest price-sensitive company announcements or qualitative material. Simply Wall St has no position in any stocks mentioned.
Have feedback on this article? Concerned about the content? Get in touch with us directly. Alternatively, email editorial-team@simplywallst.com