
- PRICING
- LIVE QUOTES
- LEARN
- HELP


EN
Cigna (CI) Stock Looks Cheap Following Its 44% Five Year Gain
Cigna Group has delivered a 43.7% gain over the past 5 years, yet the stock is down over the past year, which raises a sharper question today about whether its current price lines up with the earnings that underpin it. With that mixed share performance and fresh corporate plans on the table, investors are again asking what they are really paying for in Cigna Group's profit stream.
- The 43.7% return over 5 years puts a lot of long term optimism into the share price, so the key issue is whether current earnings can shoulder that history.
- The newly announced US$3b modernization program and the "Lead to One" vision may support future efficiency and earnings power, but they also shape how quickly profits might grow relative to today's valuation.
- Your read on Cigna Group is one view; the desks covering it have another. See what analysts think Cigna Group's shares could be worth.
The stock's next move may depend on whether Cigna Group's current earnings profile can support today's share price when judged against the Fair Ratio benchmark.
If you want other starting points while you assess whether Cigna Group's earnings justify its current price, a focused stock screen built around 28 high quality undervalued stocks is worth considering.
Is Cigna Group a Bargain on Earnings?
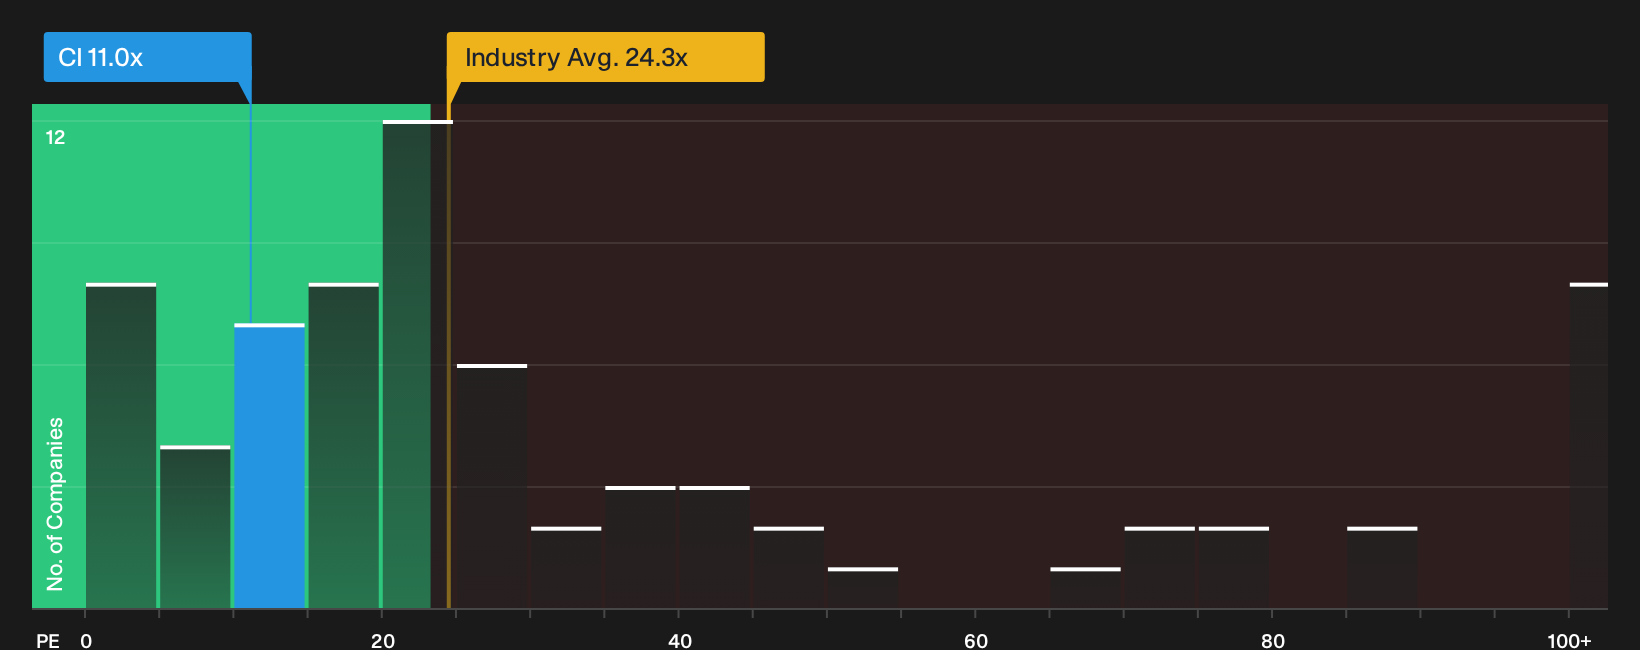
For a mature insurer like Cigna Group, the P/E multiple is usually the cleanest snapshot of how the market is weighing its earnings power. The stock trades on about 11.0x earnings, which is well below the wider Healthcare sector on roughly 24.3x and also under the closer peer group on about 29.8x. That gap tells you investors are paying less for each dollar of Cigna Group's profit than for many comparable healthcare stocks.
Because the Fair Ratio benchmark adjusts for factors such as growth profile, margins, scale and risk, it points to Cigna Group screening as undervalued on this earnings yardstick. Despite the "Lead to One" modernization plan and the reaffirmed 2026 guidance, the current P/E still reflects a clear discount to sector and peer averages. The key question for you is whether the earnings path that flows from those plans closes that gap, or whether the lower multiple is an ongoing trade off for perceived risk. Explore the numbers behind Cigna Group's P/E valuation.
The Cigna Group Narrative: What Would Justify Today's Price?
Simply Wall St Narratives pick up where the valuation puzzle for Cigna Group leaves off. They spell out which future paths for growth, margins and earnings would need to play out for the stock to deserve a meaningfully higher or lower price than today. Each one treats Cigna Group's fair value as a hypothesis about how the business might develop that you can track over time on the Community page, rather than a one off snapshot.
One of the top community narratives on Cigna Group: 21% undervalued
"The current valuation implies the share price does not fully reflect this narrative, which views Cigna Group as undervalued and suggests that long-term earnings from Specialty & Care Services, Signature, and AI-enabled efficiencies could be stronger…"
Discover why this Narrative puts Cigna Group at 21% undervalued.
Cigna Group’s valuation still leaves one crucial issue unresolved
Price and earnings only tell part of the story for Cigna Group, because separate checks have raised concerns that investors may want to weigh before leaning on the numbers alone. Take a closer look at 1 warning sign before settling on a valuation.
This article by Simply Wall St is general in nature. We provide commentary based on historical data and analyst forecasts only using an unbiased methodology and our articles are not intended to be financial advice. It does not constitute a recommendation to buy or sell any stock, and does not take account of your objectives, or your financial situation. We aim to bring you long-term focused analysis driven by fundamental data. Note that our analysis may not factor in the latest price-sensitive company announcements or qualitative material. Simply Wall St has no position in any stocks mentioned.
Have feedback on this article? Concerned about the content? Get in touch with us directly. Alternatively, email editorial-team@simplywallst.com