
- PRICING
- LIVE QUOTES
- LEARN
- HELP


EN
ams-OSRAM (SWX:AMS) Stock Looks Like A Bargain After A 150% Run
ams-OSRAM has climbed sharply in 2026, with the share price now far above where it started the year. That puts a spotlight on whether that move lines up with its sales profile. With the stock’s history of large swings still fresh, investors are asking if the current price is grounded in what the company is actually generating in revenue.
- The stock is up 150.3% year to date, which raises the question of how much sales strength is already baked into the current price.
- Recent work on thin-film VCSELs and AI data center links with BizLink may support expectations for future top-line growth if these technologies convert into meaningful customer demand.
- The analysts covering ams-OSRAM have run their own numbers. See what analysts think ams-OSRAM's shares could be worth.
The issue now is whether ams-OSRAM’s current share price can be explained by its sales when set against that Fair Ratio benchmark.
For context on how ams-OSRAM’s AI-focused optical work compares with other listed businesses tied to similar themes, you can review the 90 AI infrastructure stocks.
Is ams-OSRAM Still Cheap on Sales?
P/S fits ams-OSRAM because investors are currently more focused on what each unit of sales costs than on reported earnings, which are still affected by heavy investment and past losses.
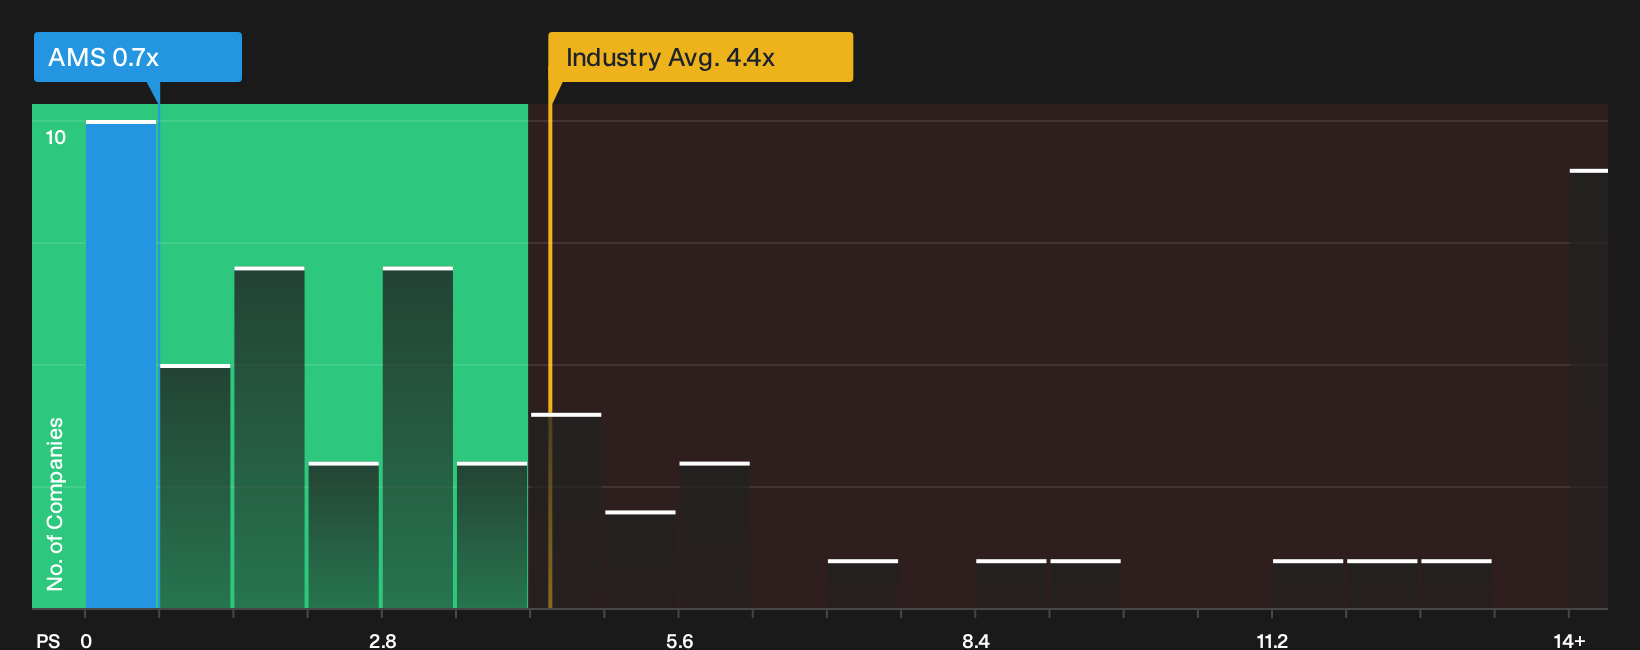
The stock trades on a P/S ratio of 0.7x, compared with a semiconductor sector average of 4.4x and a peer group average of about 3.9x. On a Fair Ratio framework, which looks at the multiple you might expect given ams-OSRAM’s growth profile, margins, size and risk, that points to the shares screening as undervalued on revenue. The valuation gap is especially striking because the recent thin-film VCSEL and AI data center link news has lifted the story without closing the discount that the P/S multiple implies relative to those benchmarks. Explore the numbers behind ams-OSRAM's P/S valuation.
The ams-OSRAM Narrative: What Would Justify Today's Price?
Simply Wall St Narratives for ams-OSRAM pick up where the P/S comparison stops and spell out which combinations of future growth, margins and earnings would need to hold for the stock to look meaningfully stronger or weaker than today's price on the Community page. Rather than a single valuation output, they lay out the economic path that figure rests on so you can watch how real-world progress lines up with that story over time.
A clear, number-driven Narrative on ams-OSRAM gives you a concrete way to track whether the thin-film VCSEL platform and BizLink data center link work eventually line up with the current P/S story. It forces expectations on sales, margins and execution into the open so you can check those assumptions against how the business actually performs over time.
Share your own Narrative for ams-OSRAM and set out the assumptions behind your valuation.
The ams-OSRAM share price is only one piece of the decision
Valuation work on ams-OSRAM tells only part of the story, since recent checks have also flagged specific risks that could change how you view the opportunity once you see them in detail. Take a closer look at 2 warning signs (1 major) before settling on a valuation.
This article by Simply Wall St is general in nature. We provide commentary based on historical data and analyst forecasts only using an unbiased methodology and our articles are not intended to be financial advice. It does not constitute a recommendation to buy or sell any stock, and does not take account of your objectives, or your financial situation. We aim to bring you long-term focused analysis driven by fundamental data. Note that our analysis may not factor in the latest price-sensitive company announcements or qualitative material. Simply Wall St has no position in any stocks mentioned.
Have feedback on this article? Concerned about the content? Get in touch with us directly. Alternatively, email editorial-team@simplywallst.com