
- PRICING
- LIVE QUOTES
- LEARN
- HELP


EN
Kagome (TSE:2811) Leaves FTSE All World Index, Is The Valuation Now Cheap?
Kagome (TSE:2811) has been removed from the FTSE All-World Index (USD), a change that can trigger portfolio reshuffling by index-tracking funds and influence short term trading patterns around the stock.
At around ¥2,639, Kagome’s recent 30 day share price return of 3.83% and year to date share price return of 1.57% both point to pressure rather than momentum, echoing a 12.16% decline in three year total shareholder return despite shorter term index related trading noise.
Scan beyond Kagome and track how other food and consumer names react to index changes by reviewing our hand picked 21 resilient stocks with low risk scores often favored by cautious institutional money around events like this.
Kagome has just been forced out of a major index while the share price has drifted over one year. Is this an early entry point, or a signal to stay patient and wait for cheaper terms before committing fresh capital?
Preferred P/E of 17.9x: Is it justified for Kagome?
Kagome trades on a P/E of 17.9x, which sits above both its estimated fair P/E of 17.4x and the JP Food industry average of 16.3x, so the current share price embeds a premium rather than a discount.
The P/E ratio compares the ¥2,639 share price to earnings per share and effectively shows how many years of current earnings investors are willing to pay for. For a mature food and beverage group like Kagome, with a mix of domestic processed foods and international agricultural operations, this measure often becomes a quick shorthand for how confidently the market views future profitability.
Earnings are forecast to grow 2.81% per year and management has produced 15% annual profit growth over the past 5 years. However, the most recent year recorded a slight earnings decline of 0.9% and a small step down in net profit margin to 4.4% from 4.5%. That combination suggests investors are paying up for steadiness and a 2.2% dividend rather than for rapid expansion, so the elevated multiple looks more like a price for perceived resilience than a bet on fast compounding.
The premium over the JP Food sector average P/E of 16.3x is clear, and the stock also sits above the estimated fair P/E of 17.4x. This marks a level the valuation model indicates the market could eventually converge toward if sentiment cools. Explore the SWS fair ratio for Kagome.
Result: Price-to-Earnings of 17.9x (OVERVALUED)
Still, Kagome’s removal from a major index and a 1 year total return that declined 7% highlight sentiment risks if earnings or margins soften further.
Find out about the key risks to this Kagome narrative.
Another View on Kagome’s Value
A different lens tells a very different story. Our DCF model estimates Kagome’s future cash flow value at ¥3,888.58 per share, while the stock trades at ¥2,639. On that framework the shares look materially undervalued, which raises a simple question. Is the market underpricing steady cash generation?
Look into how the SWS DCF model arrives at its fair value.
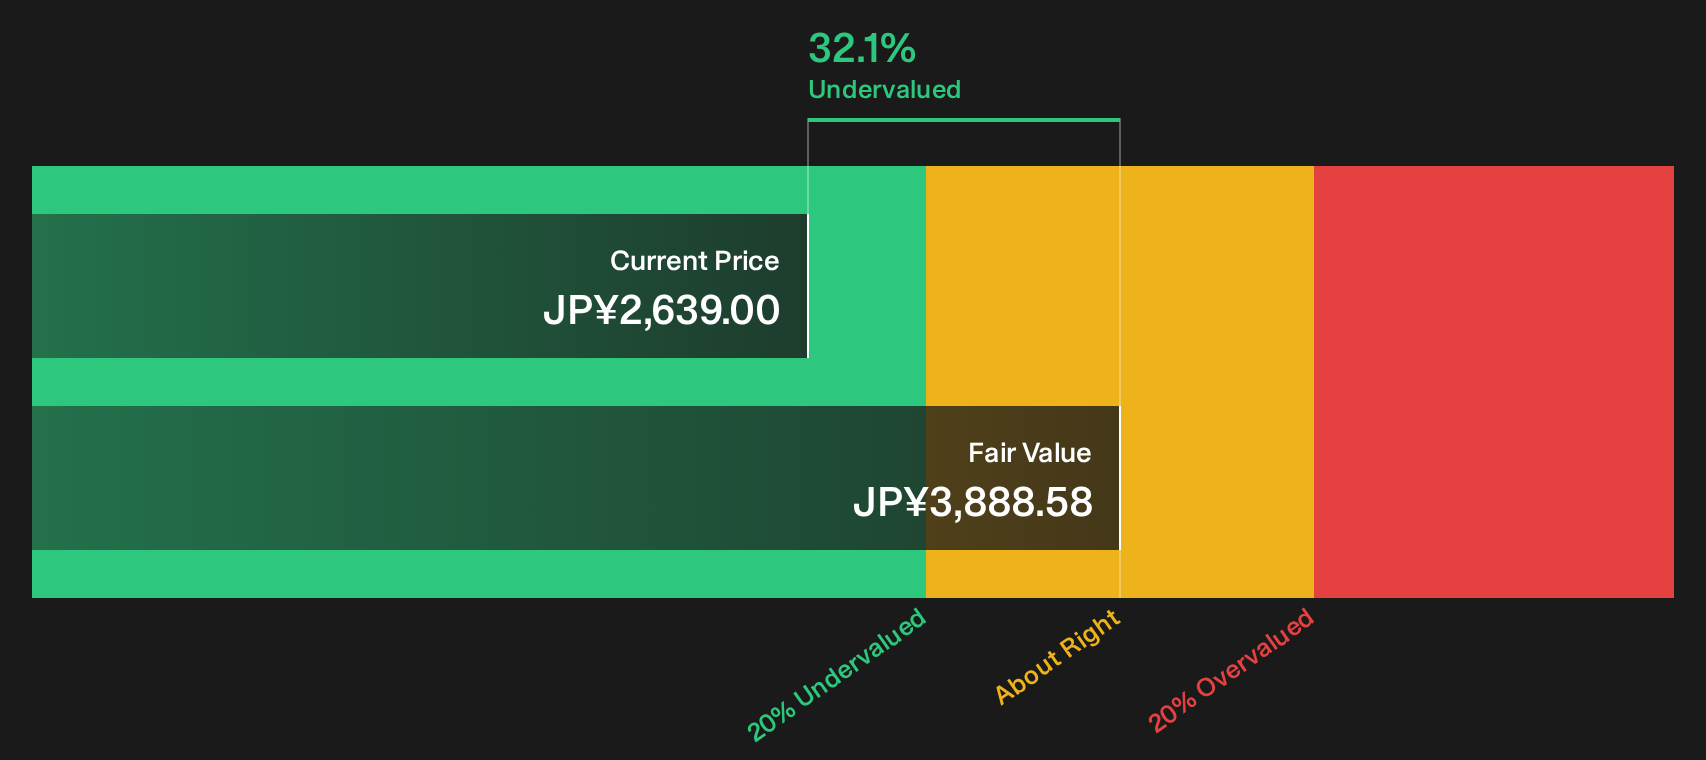
Simply Wall St performs a discounted cash flow (DCF) on every stock in the world every day (check out Kagome for example). We show the entire calculation in full. You can track the result in your watchlist or portfolio and be alerted when this changes, or use our stock screener to discover 18 high quality undervalued stocks. If you save a screener we even alert you when new companies match - so you never miss a potential opportunity.
Next Steps
The valuation signals around Kagome are mixed, so the next move rests with you. Review the detailed data while sentiment is still settling, then weigh those 3 potential upsides in the 3 key rewards
Looking for more investment ideas beyond Kagome?
If Kagome has your attention, do not stop there. Broader opportunities across sectors can help you stress test your thinking and spread risk more effectively.
- Amplify potential upside by scanning companies that combine quality with attractive entry prices through our hand picked 18 high quality undervalued stocks.
- Strengthen your income stream by focusing on businesses with higher yields and resilient payouts using the targeted 20 dividend fortresses.
- Protect your downside by zeroing in on businesses with robust finances and cleaner balance sheets through the curated list of solid balance sheet and fundamentals (23 results).
This article by Simply Wall St is general in nature. We provide commentary based on historical data and analyst forecasts only using an unbiased methodology and our articles are not intended to be financial advice. It does not constitute a recommendation to buy or sell any stock, and does not take account of your objectives, or your financial situation. We aim to bring you long-term focused analysis driven by fundamental data. Note that our analysis may not factor in the latest price-sensitive company announcements or qualitative material. Simply Wall St has no position in any stocks mentioned.
Have feedback on this article? Concerned about the content? Get in touch with us directly. Alternatively, email editorial-team@simplywallst.com