
- PRICING
- LIVE QUOTES
- LEARN
- HELP


EN
JEOL (TSE:6951) Stock Looks About Right On Earnings Today
JEOL has delivered a strong share price run in recent years, which naturally puts a spotlight on what investors are paying for its earnings today. With the stock trading around ¥7,641, the key issue is whether that level still lines up with the profit power of the business.
- JEOL has produced a 3 year share price return of 80.2%, which puts real weight on the question of how much of its earnings strength is already reflected in the current valuation.
- The company’s value story now hinges on how efficiently it can turn its specialist equipment portfolio into consistent profits, since that earnings base is what ultimately supports any P/E the market is willing to ascribe.
- Your read on JEOL is one view; the desks covering it have another. See what analysts think JEOL's shares could be worth.
The issue now is whether JEOL’s current share price is adequately supported by the level and quality of its earnings.
If you are weighing whether JEOL’s current P/E leaves enough upside, it can help to compare that question across a wider group of companies screened for 18 high quality undervalued stocks.
Where Does JEOL Sit on Earnings?
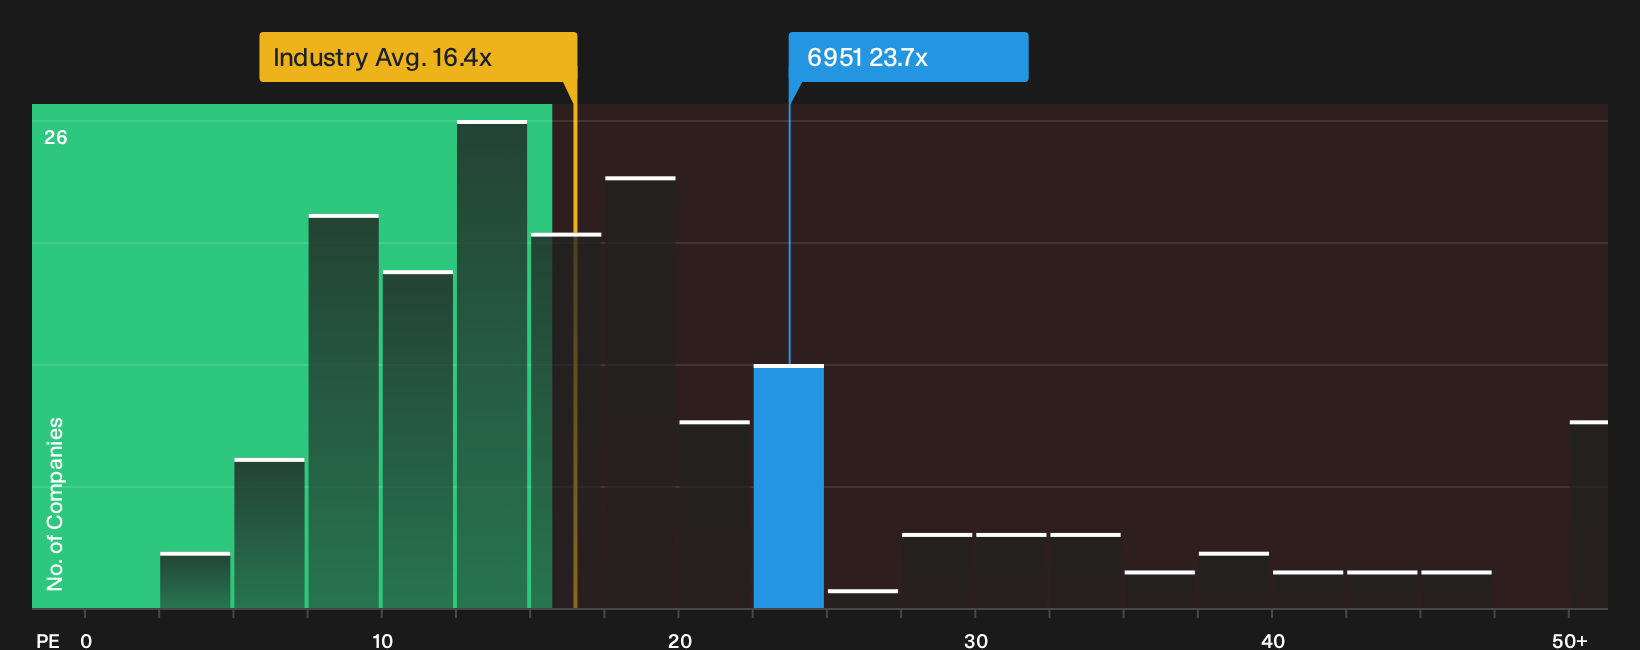
The P/E ratio suits JEOL because earnings are the core lens investors use to judge a specialist equipment producer. At a P/E of 23.7x, JEOL trades very close to the peer group average of 23.9x, which suggests the market is valuing its profit stream in line with similar electronic companies rather than attaching a clear premium or discount.
The Fair Ratio, which reflects what investors might typically pay for a business with JEOL’s mix of growth prospects, margins, size and risk, points to a P/E that is slightly lower than where the shares currently change hands. That keeps the current valuation in a zone where the price does not screen as obviously cheap or expensive on earnings alone, so anyone considering the stock needs to weigh how reliable and repeatable those profits look over time. Explore the numbers behind JEOL's P/E valuation.
The JEOL Narrative: What Would Justify Today's Price?
Simply Wall St Narratives pick up where JEOL’s valuation puzzle leaves off by spelling out what kind of future growth profile, margin path and earnings pattern would need to play out for the share price to sit meaningfully above or below today’s level. Each narrative links its number to a clear view on where JEOL’s growth, profitability and risk might head next so you can come back to that thesis as new information emerges.
A clear, written Narrative on JEOL right now gives you a concrete, number-driven view of where its growth, margins and execution might realistically head next, instead of relying on vague optimism or worry. Putting those assumptions on paper makes it far easier to test them against future results and adjust your stance as new data arrives.
Share your own Narrative for JEOL and set out the assumptions behind your valuation.
One more JEOL factor worth checking before you move on
Price and earnings only tell part of the JEOL story. The internal checks have also highlighted potential pressure points that a careful shareholder will want to weigh for themselves. Take a closer look at 1 major warning sign before settling on a valuation.
This article by Simply Wall St is general in nature. We provide commentary based on historical data and analyst forecasts only using an unbiased methodology and our articles are not intended to be financial advice. It does not constitute a recommendation to buy or sell any stock, and does not take account of your objectives, or your financial situation. We aim to bring you long-term focused analysis driven by fundamental data. Note that our analysis may not factor in the latest price-sensitive company announcements or qualitative material. Simply Wall St has no position in any stocks mentioned.
Have feedback on this article? Concerned about the content? Get in touch with us directly. Alternatively, email editorial-team@simplywallst.com