
- PRICING
- LIVE QUOTES
- LEARN
- HELP


EN
Commercial Metals (CMC) Stock Looks Like A Bargain As 109% Five Year Run
Commercial Metals has given long term shareholders a strong ride, with the stock up 109.1% over the past 5 years, yet the recent pullback raises a fresh question about what investors are really paying for its earnings today. With the share price at US$62.05 after declines over the past month and year to date, the key issue is whether that level still lines up with the profit power of the business.
- The 109.1% return over 5 years means anyone looking at Commercial Metals now has to ask if the current earnings profile can still carry that kind of long haul performance story.
- The group relies heavily on turning steel production and recycling capacity into consistent profit, so the durability of margins and cash generation may support or limit how much investors are willing to pay for each dollar of earnings.
- The analysts covering Commercial Metals have run their own numbers. See what analysts think Commercial Metals's shares could be worth.
The stock's next move may depend on whether the current share price is adequately supported by Commercial Metals' earnings when set against the Fair Ratio benchmark.
If you want a clearer benchmark for what you are paying for each dollar of earnings at Commercial Metals, it can help to compare it with 32 high quality undervalued stocks.
Does Commercial Metals Look Undervalued on Earnings?
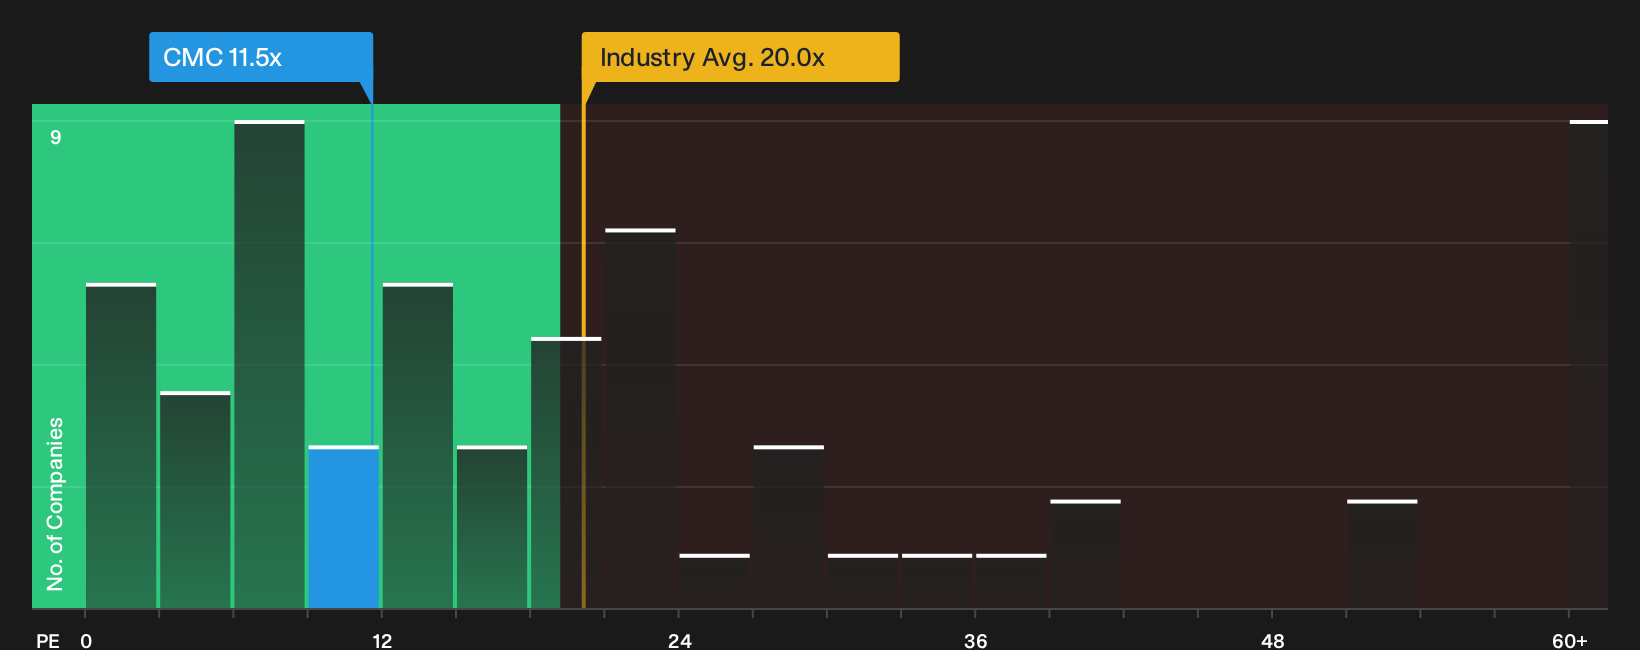
The P/E ratio is a natural starting point for a mature, cash generative operator like Commercial Metals. On this measure, the stock trades on about 11.5x earnings, well below the Metals and Mining industry average of roughly 20.0x and also under the peer group average of about 20.3x. That is a wide gap for a business the market already knows well, rather than a newly listed or unproven story.
The Fair Ratio, which blends factors such as Commercial Metals' profitability profile, sector, size and risk, points to a higher P/E than the one currently implied in the share price. That leaves the valuation screening as undervalued on this framework, with the market applying a clear discount to the earnings line. For anyone weighing whether that gap is justified by the company specific risks and capital needs, it can be useful to see how far the current multiple sits from this tailored benchmark. Explore the numbers behind Commercial Metals's P/E valuation.
The Commercial Metals Narrative: What Would Justify Today's Price?
Simply Wall St Narratives pick up where the Commercial Metals valuation puzzle leaves off by spelling out which combinations of future growth, margins and earnings would need to occur for the stock to look meaningfully higher or lower than today's price based on different viewpoints from the Community page. Each narrative links its number to a specific view on how Commercial Metals' expansion prospects, profitability and risk profile could evolve, giving you something concrete to revisit as fresh information comes through.
One of the top community narratives on Commercial Metals: 23% undervalued
"CMC's strategic initiatives, particularly the Transform, Advance, and Grow (TAG) program, are projected to generate an additional $25 million in benefits over the rest of fiscal 2025..."
Discover why this Narrative puts Commercial Metals at 23% undervalued.
One more factor for Commercial Metals that belongs beside the earnings multiple
Before treating Commercial Metals' valuation gap as the whole story, it helps to know that separate checks flag specific business risks that could change how you view the trade off between price and quality. Take a closer look at 1 warning sign before settling on a valuation.
This article by Simply Wall St is general in nature. We provide commentary based on historical data and analyst forecasts only using an unbiased methodology and our articles are not intended to be financial advice. It does not constitute a recommendation to buy or sell any stock, and does not take account of your objectives, or your financial situation. We aim to bring you long-term focused analysis driven by fundamental data. Note that our analysis may not factor in the latest price-sensitive company announcements or qualitative material. Simply Wall St has no position in any stocks mentioned.
Have feedback on this article? Concerned about the content? Get in touch with us directly. Alternatively, email editorial-team@simplywallst.com