
- PRICING
- LIVE QUOTES
- LEARN
- HELP


EN
Is CPI FIM (BDL:ORCL) Undervalued Following Its Recent Share Price Swings?
CPI FIM (BDL:ORCL) drew investor attention after a recent share price move, with the stock closing at €0.74 and short term returns showing sharp swings across the past week and month.
Recent trading in CPI FIM has been choppy, with a 1 day share price return of 2.78% and a 7 day gain of 4.23%. This comes after a 30 day share price decline of 10.84% and a year to date drop of 26%.
Scan how CPI FIM stacks up against hand-picked real estate peers by reviewing list of solid balance sheet and fundamentals (205 results) in today's volatile market.
For CPI FIM, a choppy share price and a wide gap to some estimated intrinsic values raise a simple tension. Are investors reacting to the real estate portfolio and earnings power, or is sentiment swinging more than the business warrants?
Price-to-Earnings of 5.3x: Is it justified?
CPI FIM trades on a P/E of 5.3x, which sits against a last close of €0.74 and suggests the stock is priced below many real estate peers based on current earnings.
The P/E ratio compares what investors pay for each euro of current profit. For a property investor and asset manager like CPI FIM, this link between share price and earnings is one way to see how the market is treating its income generating portfolio today.
With CPI FIM valued at 5.3x earnings, while the wider European real estate sector is on 11.4x and the peer group average is 8.7x, the market is applying a lower earnings multiple to this business than to these comparable companies.
See what the numbers say about this price — find out in our valuation breakdown..
Result: Price-to-Earnings of 5.3x (UNDERVALUED)
Still, CPI FIM faces risk if real estate values weaken or if rental income from key markets such as Poland and the Czech Republic comes under pressure.
Find out about the key risks to this CPI FIM narrative.
Another view on CPI FIM's value
The low P/E hints at a discount, yet our DCF model indicates an even steeper picture. Based on estimated future cash flows, CPI FIM at €0.74 is trading about 75.6% below an assessed value of €3.03, which highlights a much larger gap than earnings alone suggest.
Both yardsticks point to a cheap stock, but for very different reasons. One relies on current profit, the other on long term cash generation. Which one do you trust more when the signals are this far apart?
Look into how the SWS DCF model arrives at its fair value.
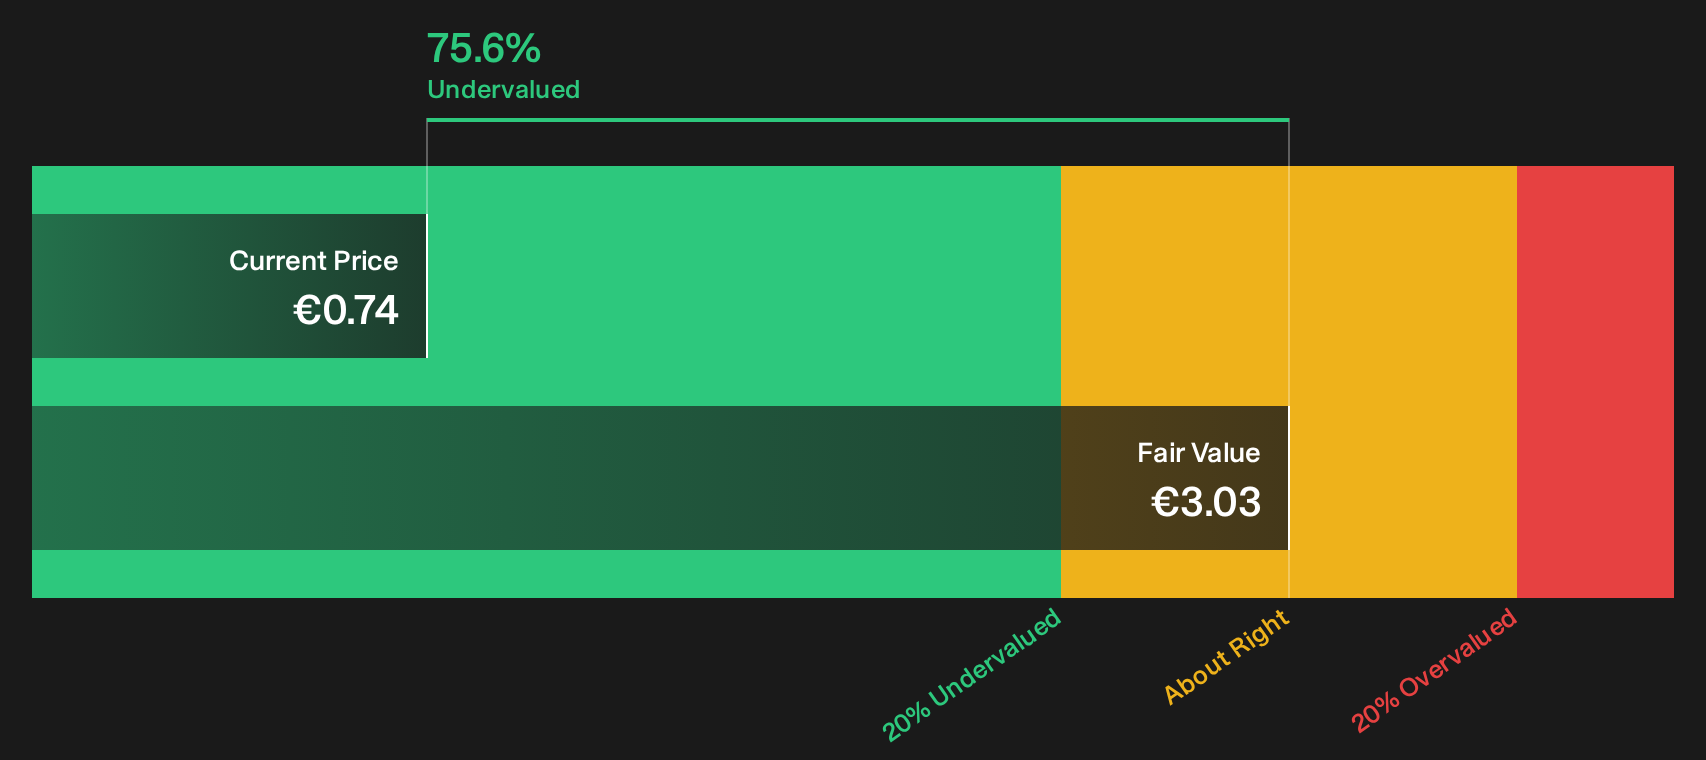
Simply Wall St performs a discounted cash flow (DCF) on every stock in the world every day (check out CPI FIM for example). We show the entire calculation in full. You can track the result in your watchlist or portfolio and be alerted when this changes, or use our stock screener to discover 196 high quality undervalued stocks. If you save a screener we even alert you when new companies match - so you never miss a potential opportunity.
Next Steps
Mixed signals around CPI FIM's valuation and risk profile only matter if you put them in your own context. Act quickly, review the data that matters most to you, and weigh both the upside and the threats by checking the 2 key rewards and 4 important warning signs.
Looking for more CPI FIM style investment ideas?
If CPI FIM has caught your attention, do not stop here. Use the Simply Wall Street Screener to uncover fresh opportunities that fit your approach.
- Target value opportunities that combine quality and a potential discount by scanning our curated set of 196 high quality undervalued stocks.
- Prioritise resilience and sleep easier at night by reviewing companies from the 226 resilient stocks with low risk scores.
- Get ahead of the crowd by spotting underfollowed prospects inside the 620 high quality undiscovered gems.
This article by Simply Wall St is general in nature. We provide commentary based on historical data and analyst forecasts only using an unbiased methodology and our articles are not intended to be financial advice. It does not constitute a recommendation to buy or sell any stock, and does not take account of your objectives, or your financial situation. We aim to bring you long-term focused analysis driven by fundamental data. Note that our analysis may not factor in the latest price-sensitive company announcements or qualitative material. Simply Wall St has no position in any stocks mentioned.
Have feedback on this article? Concerned about the content? Get in touch with us directly. Alternatively, email editorial-team@simplywallst.com