
- PRICING
- LIVE QUOTES
- LEARN
- HELP


EN
Reinvesting T. Rowe Price's Dividend for 20 Years Changes the Math Completely. Here's How.
Key Points
T. Rowe Price pays out a nearly 5% dividend yield.
It has increased its dividend every year for 40 years.
The reinvested dividend gives T. Rowe Price a more competitive long-term return.
There are not many dividend stocks that are better than T. Rowe Price (NASDAQ: TROW).
The asset management firm has increased its dividend for 40 straight years, putting it well on its way to becoming a Dividend King.
Missed Nvidia in 2009? This Rare Signal Is Flashing Again. In 2009, a "Double Down" signal flashed for a little-known chipmaker called Nvidia. For the first time in years, that same "Total Conviction" signal is flashing for a company 1/100th the size of Nvidia. Continue »
It has been an exceptional and consistent dividend stock because of its financial management. The company carries virtually no long-term debt, and has not carried debt for years. That rock-solid balance sheet gives T. Rowe Price the foundation to feed its dividend every year, with a healthy yield, without ever extending itself too far.
Currently, T. Rowe Price is paying out a super-high yield of 4.93% and its payout ratio is around 49%, which is in a nice, comfortable zone.
So, the problem with T. Rowe Price has never been its dividend. However, it has never really produced great returns.

Image source: Getty Images.
Lagging returns
During the bull market of the 2010s, T. Rowe Price underperformed its peers as an active manager with higher fees compared to its passive competitors that were generating higher or competitive returns with lower fees.
The asset manager was also late to the exchange-traded fund (ETF) party. It didn't introduce its first ETFs until 2020 -- years, decades even, after its competitors did. This set T. Rowe Price back as ETFs took off and became one of the fastest-growing investment vehicles in history.
Even after it launched them, assets have been slow to roll in. Many investors, including institutions, want a three- to five-year track record at least to judge it on. It has also underperformed again during the current bull market, as the chart below shows.
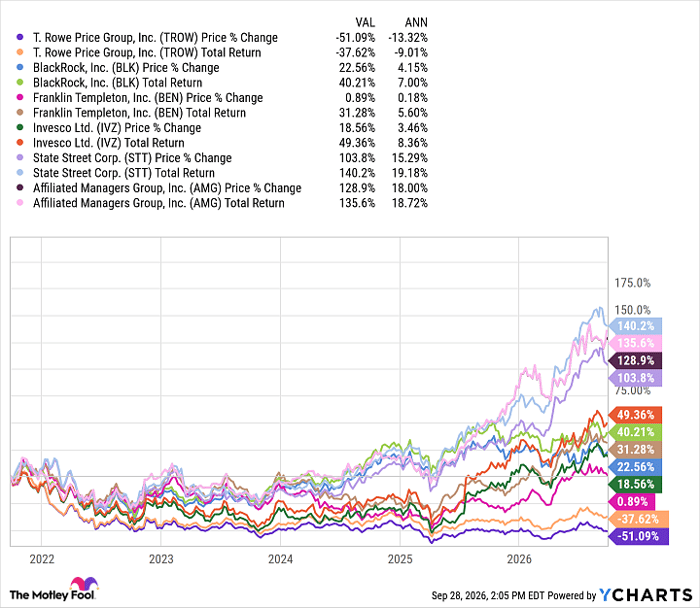
The stock price is up just 1% year to date. It has averaged annualized returns of just 0% over the past three years, -13% over the past five years, and roughly 5% over the past 10 years. But the math changes a bit when you reinvest the dividend.
Changing the math
Over the past 10 years, T. Rowe Price has had high dividend yields in the 2% to 5% range. If you reinvested that high dividend each quarter, the total average annualized return increases significantly, from about 5% to around 9%.
If you go back 20 years, the average annualized total return, with dividend reinvested, increases to about 7.5%, up from 3.9% without the dividend reinvested. That would make T. Rowe Price's 20-year return roughly the same as that of State Street (NYSE: STT) and better than those of all of the others on the chart except BlackRock (NYSE: BLK).
If you had invested $10,000 in T. Rowe Price stock 20 years ago, and reinvested the dividends, you would have about $96,000 today contributing $100 per month. If you did not reinvest the dividends, you would have about $57,000. That's the boost that the dividend can provide if reinvested.
Dave Kovaleski has no position in any of the stocks mentioned. The Motley Fool has positions in and recommends BlackRock and T. Rowe Price Group. The Motley Fool recommends Affiliated Managers Group. The Motley Fool has a disclosure policy.