
- PRICING
- LIVE QUOTES
- LEARN
- HELP


EN
Sangoma Technologies (TSX:STC) Stock Confronts Deepening Losses After Rally
Traders pushed Sangoma Technologies up over the past month, with the stock closing at CA$6.98 and logging a strong 30-day gain, only to be hit today with a harsh reality check. The latest quarter delivered a steep earnings loss of US$2.24 per share and a net loss of US$74.43 million on US$46.80 million in sales. That profit squeeze is the real story. Short term enthusiasm ran straight into a communications software business that is still wrestling with heavy losses and a valuation that already prices in a turnaround.
Is Sangoma Technologies a genuine mispricing story at a 0.8x P/S, or is the discount simply the market pricing in persistent losses? Compare that debate to our valuation analysis for Sangoma Technologies
Q4 2026 Earnings Summary
- Revenue (Q4 2026 vs. Q4 2025): US$46.80 million vs. US$59.36 million (decline of about 21%)
- Net Income/Loss (Q4 2026 vs. Q4 2025): net loss of US$74.43 million vs. net income of US$0.21 million (loss widened very significantly)
- Basic EPS (Q4 2026 vs. Q4 2025): loss of US$2.24 per share vs. earnings of US$0.01 per share (shift to a very large per share loss)
- Trailing 12-Month Net Income/Loss (Q4 2026 vs. Q4 2025): net loss of US$81.09 million vs. net loss of US$5.01 million (full year loss expanded sharply)
Prefer clear charts instead of another wall of small-print numbers and footnotes? See Sangoma Technologies’ full financial picture in a visual dashboard, with a focus on its valuation context and how the market is framing the recent losses, in our company report for Sangoma Technologies.
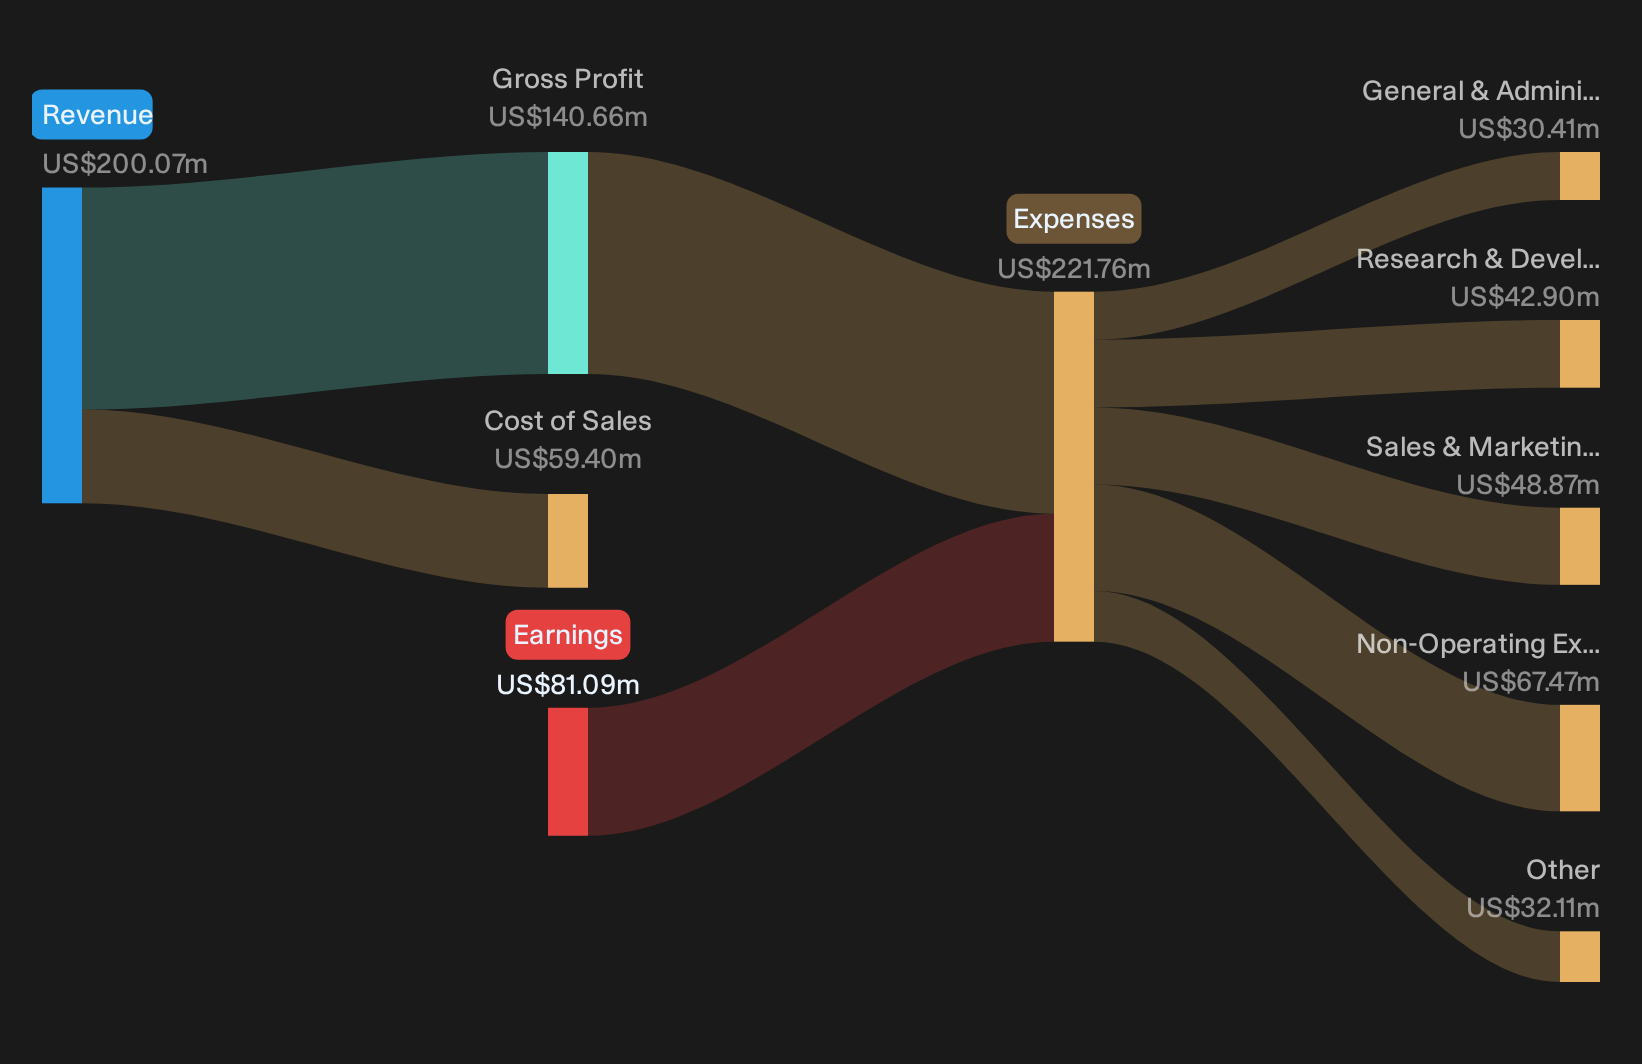
Sangoma Bull Case Meets Harsh Operating Reality
Bulls argue Sangoma Technologies is quietly building a higher quality, recurring communications platform powered by larger multi‑year deployments, better retention and strong cash conversion. The latest quarter makes that roadmap harder to defend. Revenue of US$46.80 million sits well below the prior year while the firm swung from a small profit to a net loss of US$74.43 million, with a trailing loss of US$81.09 million. That scale of red ink does not yet align with a story built on improved churn and healthier, contracted usage.
The bullish view leans heavily on mix shift into voice and data networking services and margin progress. This report instead highlights pressure on overall earnings and no clear proof in the numbers that higher margin activity is offsetting application weakness. For now, Sangoma appears to be in the early stages of delivering the earnings stability that longer national retail and healthcare rollouts are expected to provide.
See whether the optimism around Sangoma Technologies’ recurring contracts and cash conversion lines up with institutional expectations by checking the consensus price target analysis for Sangoma Technologies.Sangoma Bears See Execution Risks Playing Out
The cautious view on Sangoma Technologies centers on weak applications demand, slow conversion of big deployments and fragile connectivity pricing. This quarter gives that concern real footing. Revenue of US$46.80 million now trails the prior year, which fits the worry that a larger applications portfolio under pricing pressure can drag on the whole group rather than quietly stabilizing in the background.
Profitability tells the same story. The move from a small Q4 2025 profit to a Q4 2026 net loss of US$74.43 million, and a trailing loss of US$81.09 million, points to execution strain rather than clean, delayed upside. Bears argue that long deployment cycles and uncertain AI adoption could leave contracted work and product bets under-earning for longer. These results do not disprove that. They instead highlight missed milestones on earnings stability while the longer term usage and AI benefits remain largely unproven in the income statement.
After such a sharp swing from a small profit to a deep loss, the question is whether Sangoma Technologies has simply hit a rough patch or whether the business model carries structural fragility that is not yet obvious in headline numbers. Review the independent risk analysis for Sangoma Technologies which shows 1 important warning signTake Charge Of Your Next Move
With Sangoma Technologies swinging from a small profit to a deep loss, it can help to register for FREE with Simply Wall St and add it to a Watchlist so you can track the share price against fair value and wait for a setup that matches your risk tolerance. Once you do take a position, use the Portfolio Command Center to cut through headline noise and only see the key developments that matter to your holdings. For longer term context and fresh angles, lean on the Community to compare your thesis with other investors and refine your thinking. That way you spot potential catalysts and risks earlier, and keep yourself a step ahead of the wider market.
Seeking Alternatives Before The Crowd
Fresh opportunities rarely stay quiet for long. Some are already building breakout momentum while others could be caught dropping under the radar for now. Scan them before the crowd, act now.
- Spot cash generative underdogs early and sift through 9 high quality undiscovered gems that combine solid fundamentals with stories most investors have not even started talking about yet.
- Consider strengthening electricity demand trends and track infrastructure plays related to AI and electrification through the curated 39 power grid technology and infrastructure stocks while they may still be outside mainstream attention.
- Explore future facing automation candidates and filter potential leaders in smart factories and logistics using the hand picked 92 robotics and automation stocks before short-term momentum becomes a stronger focus.
This article by Simply Wall St is general in nature. We provide commentary based on historical data and analyst forecasts only using an unbiased methodology and our articles are not intended to be financial advice. It does not constitute a recommendation to buy or sell any stock, and does not take account of your objectives, or your financial situation. We aim to bring you long-term focused analysis driven by fundamental data. Note that our analysis may not factor in the latest price-sensitive company announcements or qualitative material. Simply Wall St has no position in any stocks mentioned.
Have feedback on this article? Concerned about the content? Get in touch with us directly. Alternatively, email editorial-team@simplywallst.com