
- PRICING
- LIVE QUOTES
- LEARN
- HELP


EN
Is Realty Income (O) Undervalued Following Its Recent Downgrade?
Why Realty Income Is Back in Focus
Realty Income (O) is drawing fresh attention after Scotiabank cut its rating to Sector Perform from Sector Outperform and reduced its target valuation, citing interest rate sensitivity and funds from operations pressures.
Recent trading helps explain why the downgrade is getting so much attention. Realty Income’s share price has fallen about 10.7% over the past month and roughly 10.7% over 90 days, even though the 3 year total shareholder return is up about 32.8%. This suggests that long term holders still sit on gains, while short term momentum has clearly cooled.
Scan beyond Realty Income and evaluate other potential income-focused real estate opportunities with our curated 6 dividend fortresses.
The slide has reset expectations around Realty Income and put the monthly dividend story under the microscope again. Do the current numbers still tilt the risk reward in favor of new buyers, or has the equation flipped?
Most Popular Narrative: 10.9% Undervalued
Against the last close at $55.35, the most followed fair value view for Realty Income sits at $62.11. This frames the recent pullback as a potential discount rather than just weakness.
Given the fact that Realty Income is a dividend focused company, I will value it using only valuation methods related with dividends. A fundamentally driven one and then a historical/relative one to sanity check.
See why 97 investors see Realty Income as 11% undervalued.
Result: Fair Value of $62.11 (UNDERVALUED)
Still, the income case around Realty Income can fray if funding costs stay elevated or if higher share issuance continues to pressure per share returns.
Find out about the key risks to this Realty Income narrative.
Another View On Realty Income’s Valuation
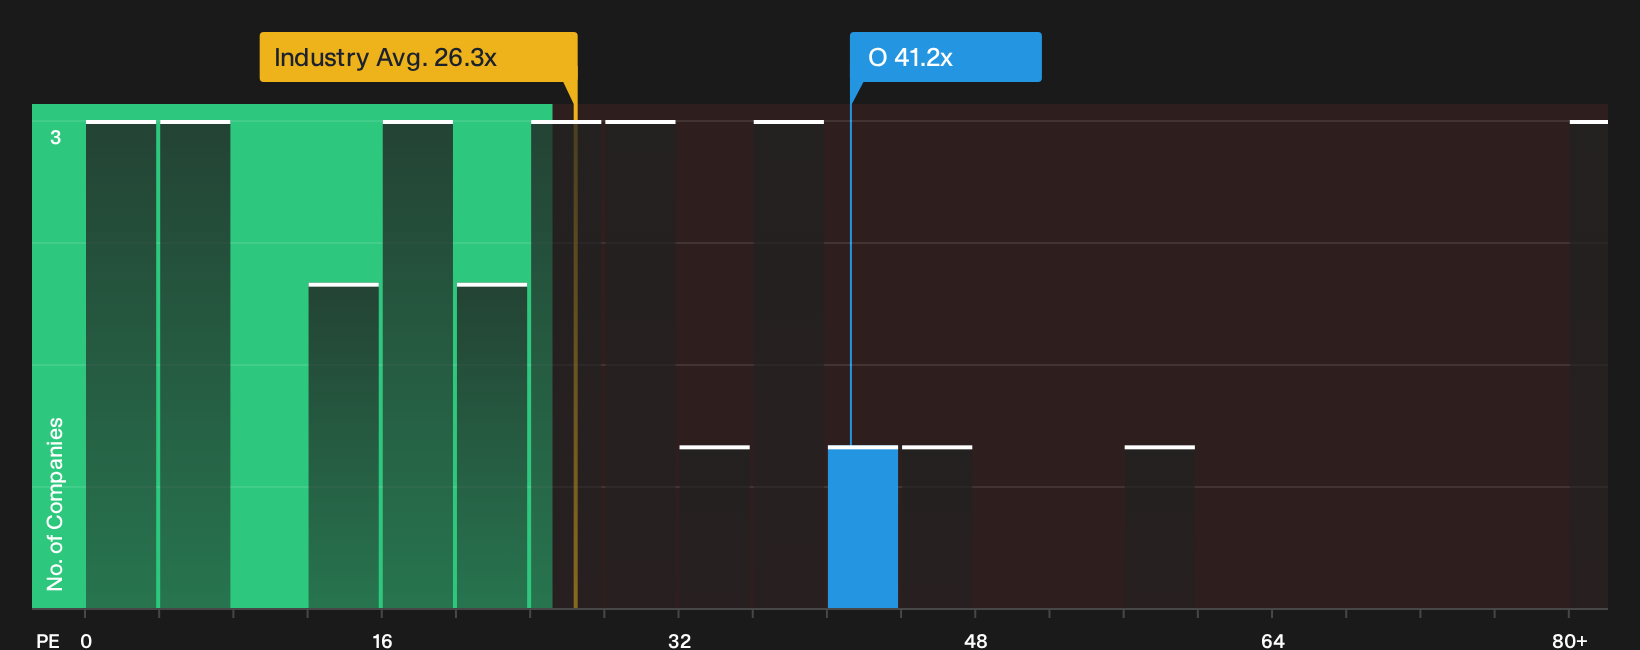
The narrative work suggests Realty Income is around 11% undervalued. The market’s own yardstick tells a rougher story. At a P/E of 41.2x against a Retail REITs industry average of 26.3x and a peer average of 26x, investors are paying a clear premium. The fair ratio of 36.6x also sits below today’s multiple, which points to valuation risk if sentiment cools further. Is that premium simply the price of perceived safety, or is it more than income investors really want to pay?
See what the numbers say about this price in our valuation breakdown See what the numbers say about this price — find out in our valuation breakdown.
Next Steps
Curious whether this mixed picture on Realty Income leans more positive or negative overall? Act sooner rather than later and weigh the trade off yourself by reviewing the 5 key rewards and 1 important warning sign.
Looking For More Investment Ideas Beyond Realty Income?
Do not stop with Realty Income alone. Use the Simply Wall St screener to spot fresh opportunities that match your income goals and risk comfort.
- Target dependable income streams by reviewing a curated set of potential yield plays through the 6 dividend fortresses.
- Hunt for quality at a discount by scanning companies that appear mispriced relative to their fundamentals using the 32 high quality undervalued stocks.
- Protect your downside by focusing on resilient businesses with healthier finances through the 30 resilient stocks with low risk scores.
This article by Simply Wall St is general in nature. We provide commentary based on historical data and analyst forecasts only using an unbiased methodology and our articles are not intended to be financial advice. It does not constitute a recommendation to buy or sell any stock, and does not take account of your objectives, or your financial situation. We aim to bring you long-term focused analysis driven by fundamental data. Note that our analysis may not factor in the latest price-sensitive company announcements or qualitative material. Simply Wall St has no position in any stocks mentioned.
Have feedback on this article? Concerned about the content? Get in touch with us directly. Alternatively, email editorial-team@simplywallst.com