
- PRICING
- LIVE QUOTES
- LEARN
- HELP


EN
Nucor (NUE) Seeks A FERC Role, Is The Stock Still Undervalued?
Nucor (NUE) just stepped into a Federal Energy Regulatory Commission proceeding by filing a motion to intervene on power market issues affecting its steel mills in the MISO electricity region.
Recent trading has been choppy for Nucor, with the share price easing 1.12% in the last session to US$244.49, dipping 2.40% over 30 days, yet still showing a 9.76% 90-day share price return and a strong 44.33% year-to-date share price gain. Over a longer horizon, total shareholder return of 82.07% over one year and 171.05% over five years points to momentum that has been building, as investors weigh recurring dividends, fresh earnings guidance, and now this intervention in power market regulation.
Scan beyond Nucor to evaluate other heavy-industry plays with resilient cash generation using our curated list of list of solid balance sheet and fundamentals (25 results)
Bulls point to Nucor's earnings guidance, long dividend streak, and fresh FERC push on power costs. Bears focus on cyclical steel exposure at a rich share price. Which side does today’s valuation evidence support?
Most Popular Narrative: 13.8% Undervalued
Nucor's most followed narrative pegs fair value around $283.63, comfortably above the last close at $244.49. This frames today’s price as a discount that depends heavily on long term project execution and trade support holding up.
Nucor's multi year capital program of roughly US$15b to US$20b, with several mills and downstream assets already EBITDA positive and capital expenditure guiding to about US$2.5b in 2026, is moving from the build phase toward cash generation, which can support higher earnings and free cash flow.
See why 98 investors see Nucor as 14% undervalued.
Result: Fair Value of $283.63 (UNDERVALUED)
Still, the whole story on Nucor can change quickly if nonresidential steel demand cools or if big projects like the West Virginia mill encounter setbacks.
Find out about the key risks to this Nucor narrative.
Another View on Nucor's Valuation
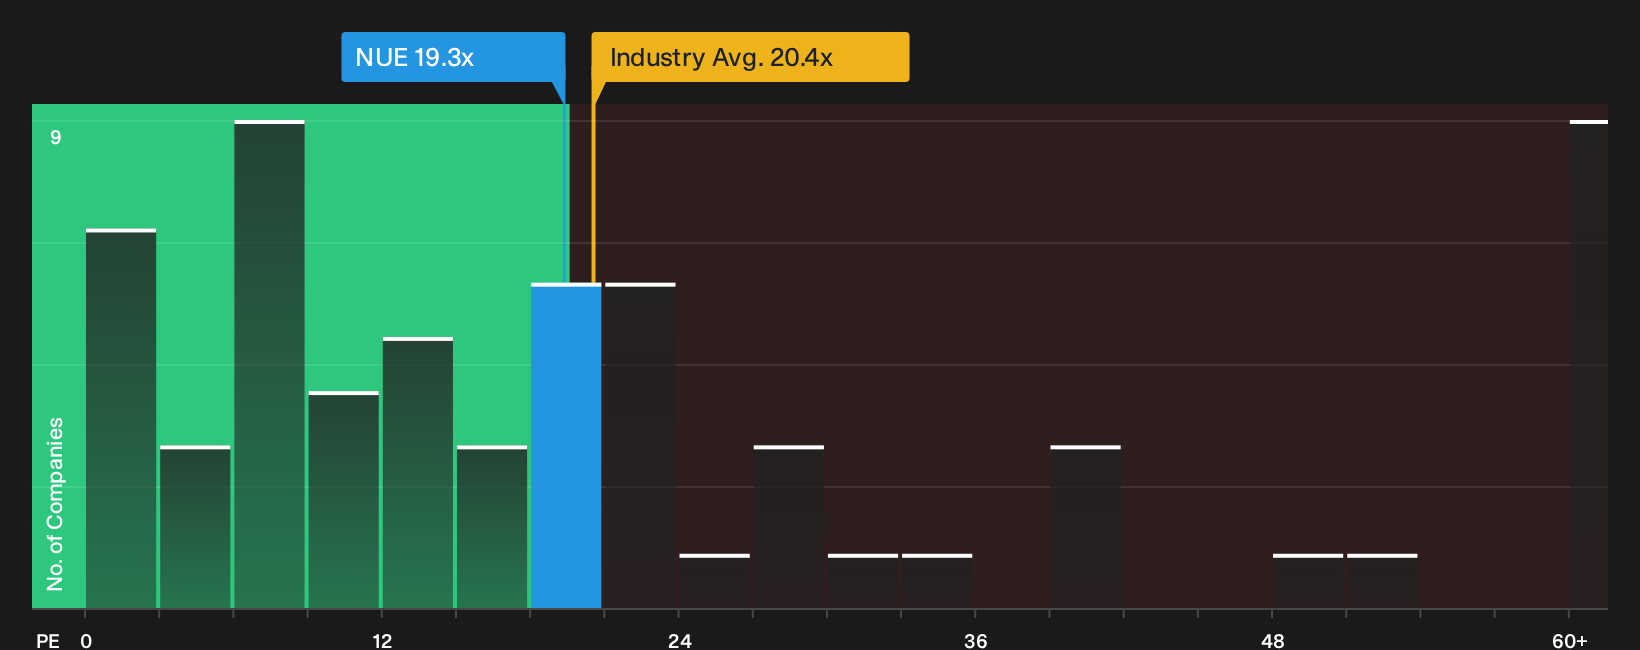
The earlier fair value narrative presents Nucor as 13.8% undervalued. On simple pricing, the picture is tighter. Nucor trades on a 19.3x P/E versus 17.5x for peers and a fair ratio of 23.6x, so the stock appears pricier than similar steel producers but below where the regression suggests the market could move. Whether that represents a cushion or a warning sign depends on your own hurdle rate.
See what the numbers indicate about this price in our valuation breakdown. See what the numbers say about this price — find out in our valuation breakdown.
Next Steps
If this mix of optimism and concern around Nucor feels familiar, do not sit on the fence. Compare the pieces with the 3 key rewards and 1 important warning sign.
Looking for more investment ideas beyond Nucor?
Nucor gives you one angle on the market. If you stop here, you could miss other opportunities that line up better with your goals and risk comfort.
- Target potential mispricings by scanning a curated set of quality companies through the 32 high quality undervalued stocks that pair strong fundamentals with what may be discounted valuations.
- Strengthen your income stream by reviewing the 6 dividend fortresses that focus on companies offering higher yields with an emphasis on staying power.
- Dial down risk in your portfolio by checking the 30 resilient stocks with low risk scores where resilient balance sheets and steadier profiles take priority over excitement.
This article by Simply Wall St is general in nature. We provide commentary based on historical data and analyst forecasts only using an unbiased methodology and our articles are not intended to be financial advice. It does not constitute a recommendation to buy or sell any stock, and does not take account of your objectives, or your financial situation. We aim to bring you long-term focused analysis driven by fundamental data. Note that our analysis may not factor in the latest price-sensitive company announcements or qualitative material. Simply Wall St has no position in any stocks mentioned.
Have feedback on this article? Concerned about the content? Get in touch with us directly. Alternatively, email editorial-team@simplywallst.com