
- PRICING
- LIVE QUOTES
- LEARN
- HELP


EN
Asian Market Insights: SSY Group And 2 Other Promising Penny Stocks
As Asian markets navigate a landscape of economic shifts and evolving trade dynamics, investors are increasingly looking at diverse opportunities across the region. Penny stocks, though often considered a niche segment, remain relevant for their potential to offer significant growth at lower price points. In this article, we explore how these smaller or newer companies can present unique investment prospects when supported by strong financials and solid fundamentals.
Let's explore several standout options from the results in the screener.
SSY Group (SEHK:2005)
Simply Wall St Financial Health Rating: ★★★★★☆
Overview: SSY Group Limited is an investment holding company that engages in the research, development, manufacturing, trading, and sale of pharmaceutical products to hospitals and distributors both within the People’s Republic of China and internationally, with a market cap of HK$8.08 billion.
Operations: The company's revenue is primarily derived from its Intravenous Infusion Solution and Others segment, contributing HK$4.17 billion, followed by Medical Materials at HK$420.33 million.
Market Cap: HK$8.08B
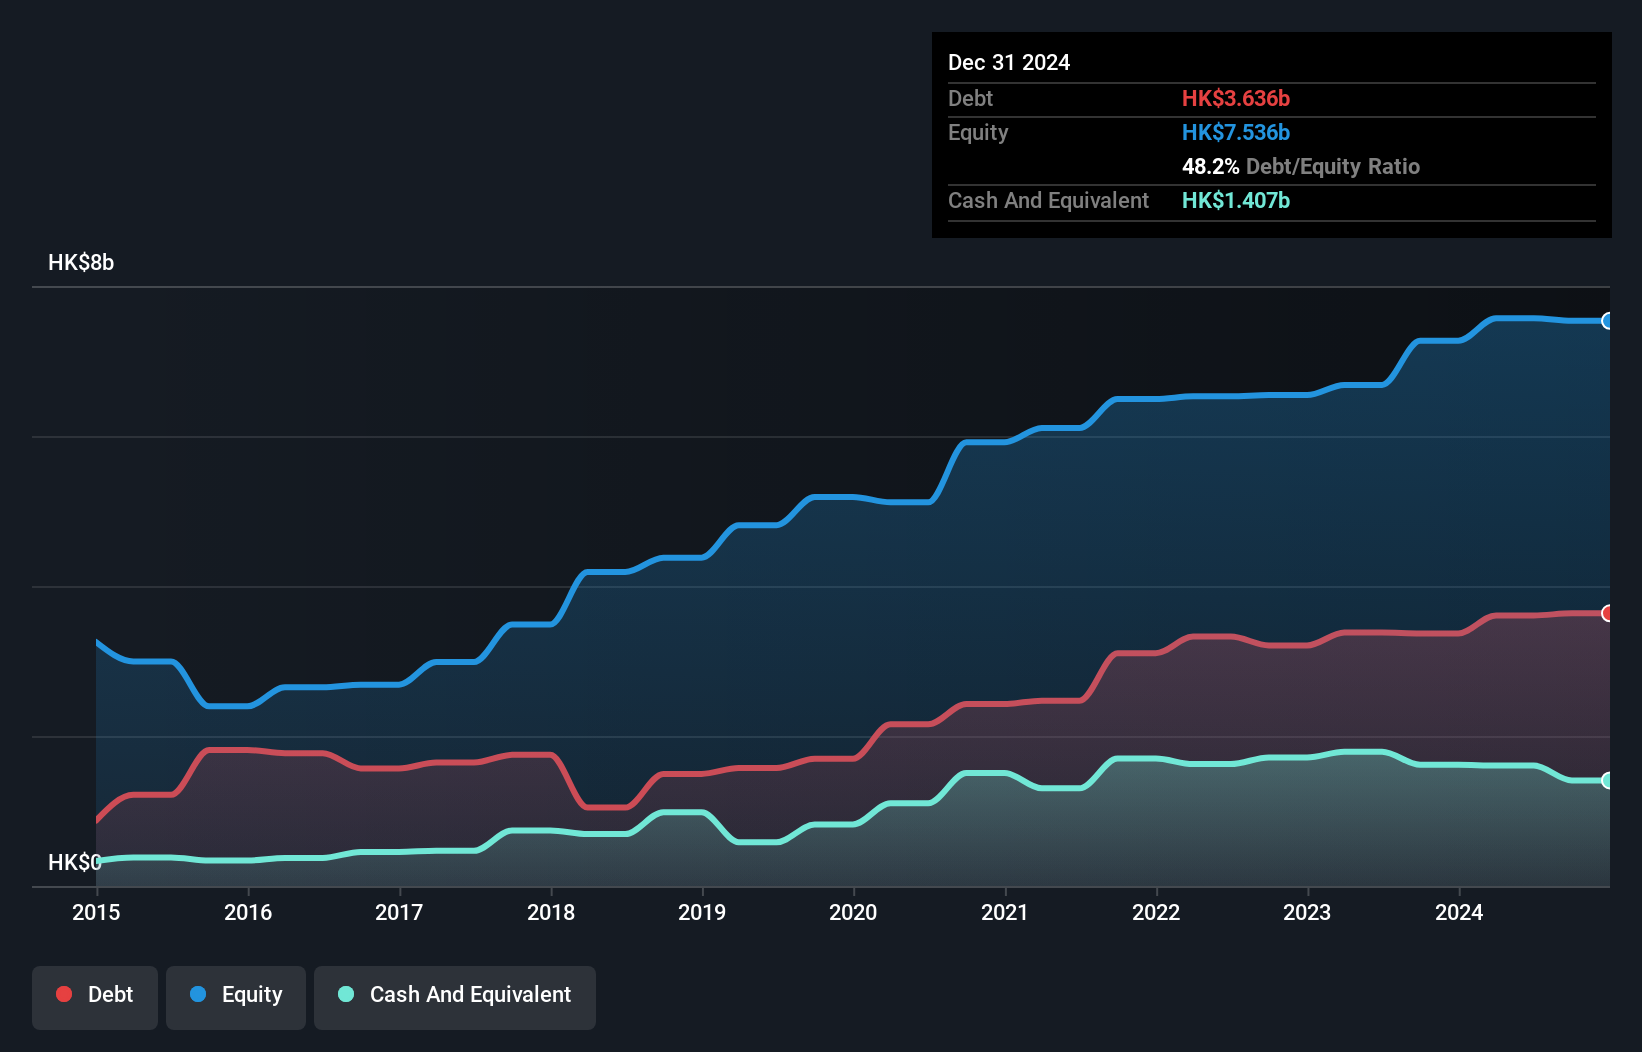
SSY Group has demonstrated resilience in the volatile penny stock market, with its short-term assets of HK$5.3 billion comfortably covering both short and long-term liabilities. Despite a decline in earnings over the past five years, recent product approvals, such as Ziprasidone Mesilate and Letermovir Injection, have expanded its pharmaceutical portfolio significantly. The company's interest payments are well-covered by EBIT at 7.8 times, indicating sound financial health despite increased debt levels over time. While profit margins have slightly decreased to 11.6%, SSY's strategic product developments could bolster future revenue streams in key therapeutic areas like antipsychotics and injectables.
- Get an in-depth perspective on SSY Group's performance by reading our balance sheet health report here.
- Gain insights into SSY Group's outlook and expected performance with our report on the company's earnings estimates.
Greentown Service Group (SEHK:2869)
Simply Wall St Financial Health Rating: ★★★★★★
Overview: Greentown Service Group Co. Ltd., along with its subsidiaries, offers residential property management services in the People's Republic of China and internationally, with a market cap of HK$13.05 billion.
Operations: The company's revenue is primarily derived from Property Services, which generated CN¥14.31 billion, and Community Living Services (excluding Technology Services), contributing CN¥2.67 billion.
Market Cap: HK$13.05B
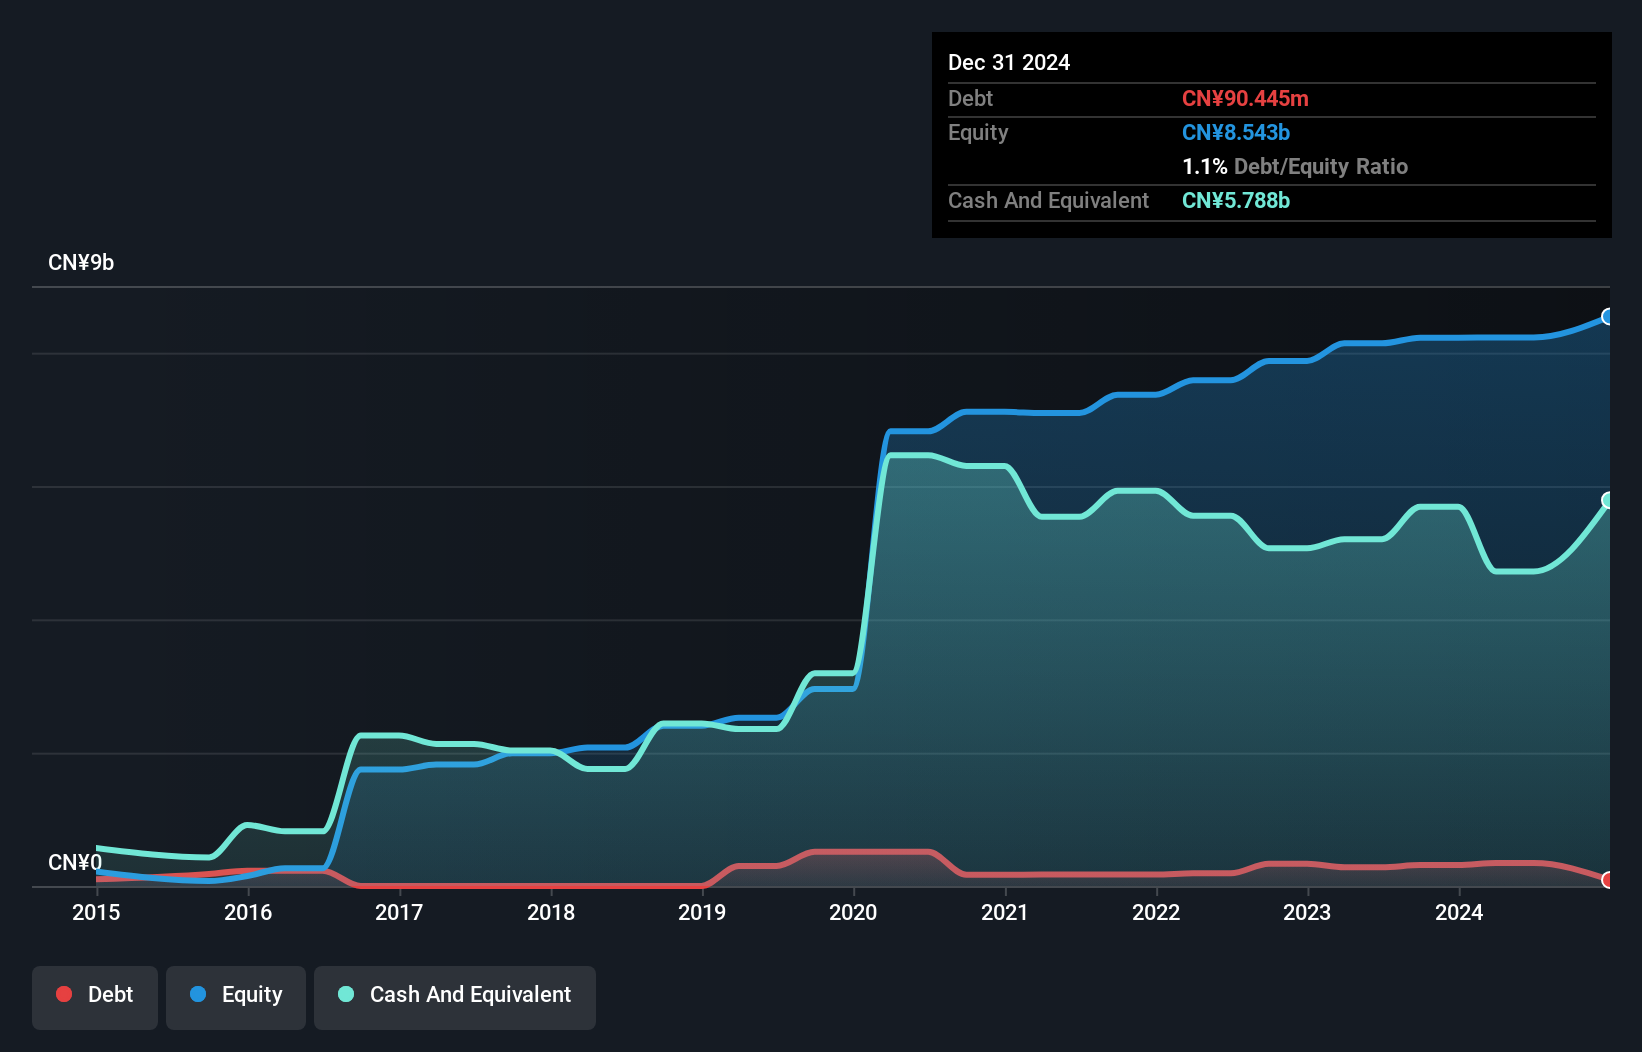
Greentown Service Group has shown promising financial health in the penny stock market, with substantial earnings growth of 23.8% over the past year, surpassing industry averages. The company's strong cash flow effectively covers its debt, and it maintains a stable balance sheet with short-term assets of CN¥14.4 billion exceeding liabilities. Recent earnings reports highlight improved net profit margins at 4.9%, up from 4.3% last year, reflecting operational efficiency despite a historically unstable dividend record. Analysts project further growth potential for Greentown Service Group's stock price while noting its trading value below estimated fair value by 47.2%.
- Click here to discover the nuances of Greentown Service Group with our detailed analytical financial health report.
- Review our growth performance report to gain insights into Greentown Service Group's future.
Oiltek International (SGX:HQU)
Simply Wall St Financial Health Rating: ★★★★★★
Overview: Oiltek International Limited is an investment holding company that supplies and provides engineering design and commissioning services for oil extraction equipment and plants across Asia, the United States, and Africa, with a market cap of SGD604.89 million.
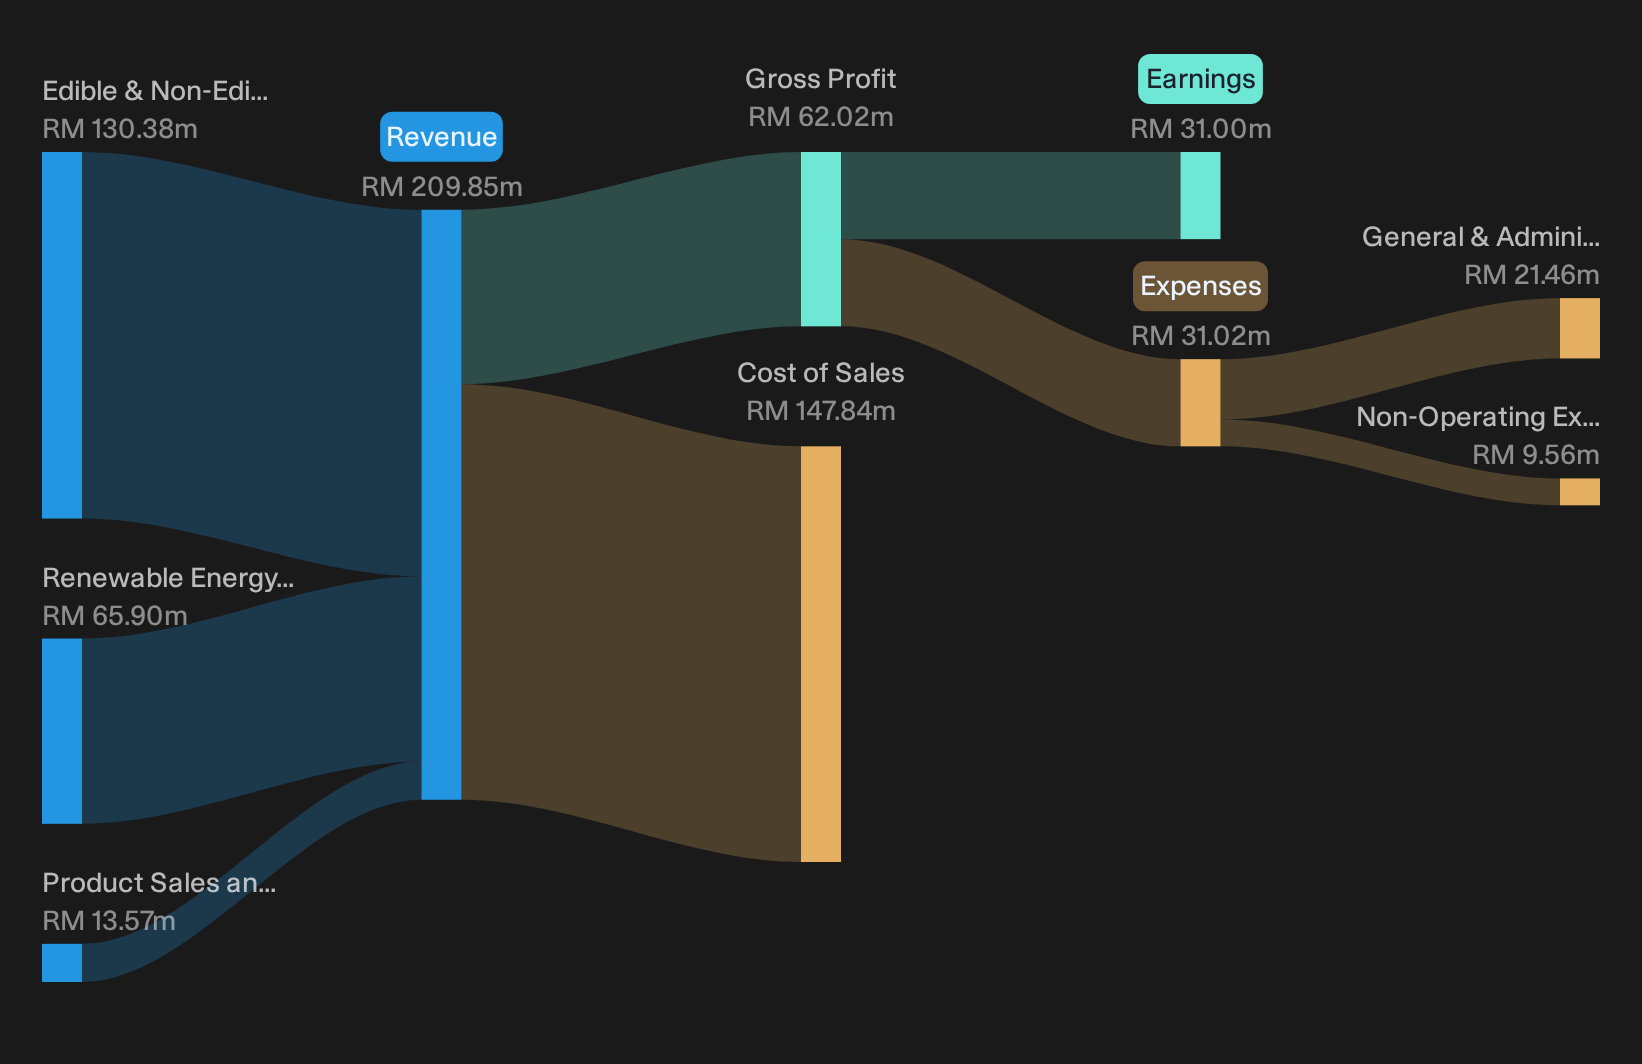
Operations: Oiltek International's revenue is primarily derived from its Edible & Non-Edible Oil Refinery segment, which accounts for MYR130.38 million, followed by Renewable Energy at MYR65.90 million and Product Sales and Trading at MYR13.57 million.
Market Cap: SGD604.89M
Oiltek International demonstrates financial stability with its short-term assets of MYR191.9 million exceeding liabilities and no debt on its balance sheet. Despite a slight decline in earnings, the company maintains high-quality past earnings and a robust return on equity at 30.1%. The recent inclusion in the S&P Global BMI Index underscores market recognition, while an interim dividend reflects commitment to shareholder returns. However, negative earnings growth over the past year contrasts with significant profit growth over five years, suggesting potential volatility. Analysts forecast substantial annual earnings growth of 64.56%, indicating optimism for future performance.
- Click to explore a detailed breakdown of our findings in Oiltek International's financial health report.
- Examine Oiltek International's earnings growth report to understand how analysts expect it to perform.
Key Takeaways
- Dive into all 1,059 of the Asian Penny Stocks we have identified here.
- Curious About Other Options? Uncover 26 companies that survived and thrived after COVID and have the right ingredients to survive Trump's tariffs.
This article by Simply Wall St is general in nature. We provide commentary based on historical data and analyst forecasts only using an unbiased methodology and our articles are not intended to be financial advice. It does not constitute a recommendation to buy or sell any stock, and does not take account of your objectives, or your financial situation. We aim to bring you long-term focused analysis driven by fundamental data. Note that our analysis may not factor in the latest price-sensitive company announcements or qualitative material. Simply Wall St has no position in any stocks mentioned.
Have feedback on this article? Concerned about the content? Get in touch with us directly. Alternatively, email editorial-team@simplywallst.com