
- PRICING
- LIVE QUOTES
- LEARN
- HELP


EN
SmartCentres Real Estate Investment Trust (TSX:SRU.UN) Reaffirmed Its Distribution, Is The Valuation Gap Too Wide?
SmartCentres Real Estate Investment Trust (TSX:SRU.UN) reaffirmed its monthly income stream, declaring a CAD 0.1542 per unit distribution payable on October 7, 2026, with key dates falling at the end of September.
At a share price of CA$26.62, SmartCentres Real Estate Investment Trust has had a mixed run. The 90 day share price return is down 12.17%, while the year to date share price return is 3.26%. Longer term total shareholder returns of 6.49% over one year and 48.34% over three years indicate that investors have still been rewarded over time.
Scan beyond SmartCentres Real Estate Investment Trust and line up other income ideas with the 1 dividend fortresses, which have been curated for investors who care about reliable cash flow.
After a 12.17% slide over 90 days and a unit price near CA$26.62 against higher value estimates, the gap has widened. Does that discount reflect risk, or has SmartCentres Real Estate Investment Trust drifted below fair value?
Preferred P/E of 24.5x: Is it justified?
Valuation work on SmartCentres Real Estate Investment Trust points in two different directions. On one side, the SWS DCF model indicates the units at CA$26.62 are trading well below an estimated future cash flow value of CA$40.38. On the other, the current P/E of 24.5x screens as expensive compared with both the Retail REITs group and closer peers.
P/E is a simple earnings multiple. It compares what investors are paying for each dollar of current profit. For a landlord like SmartCentres Real Estate Investment Trust, that ratio can reflect expectations about rental income resilience, balance sheet risk and how much of today’s earnings quality is affected by one off items such as the CA$124.5m loss that influences the latest 12 month figures.
The 24.5x P/E is higher than the North American Retail REITs industry average of 23.9x and also above the peer average of 17.6x. That is a clear premium. With net profit margins at 16.4% against 24.3% last year, a 26.4% annual earnings decline over five years, low 3.1% return on equity and interest costs that are not well covered by earnings, the current multiple implies investors are willing to pay more than they do for the typical peer despite weaker profitability trends and higher funding risk.
See what the numbers say about this price — find out in our valuation breakdown.
Result: Price-to-earnings of 24.5x (OVERVALUED)
Still, SmartCentres Real Estate Investment Trust faces potential pressure if borrowing costs stay elevated and if weaker tenant performance chips away at that high occupancy.
Find out about the key risks to this SmartCentres Real Estate Investment Trust narrative.
Another view on SmartCentres Real Estate Investment Trust
The SWS DCF model lands in a very different place. On that cash flow view, SmartCentres Real Estate Investment Trust at CA$26.62 compares with an estimated future cash flow value of CA$40.38, which points to a wide undervaluation instead of an expensive P/E story. Which yardstick should carry more weight for you right now?
Look into how the SWS DCF model arrives at its fair value.
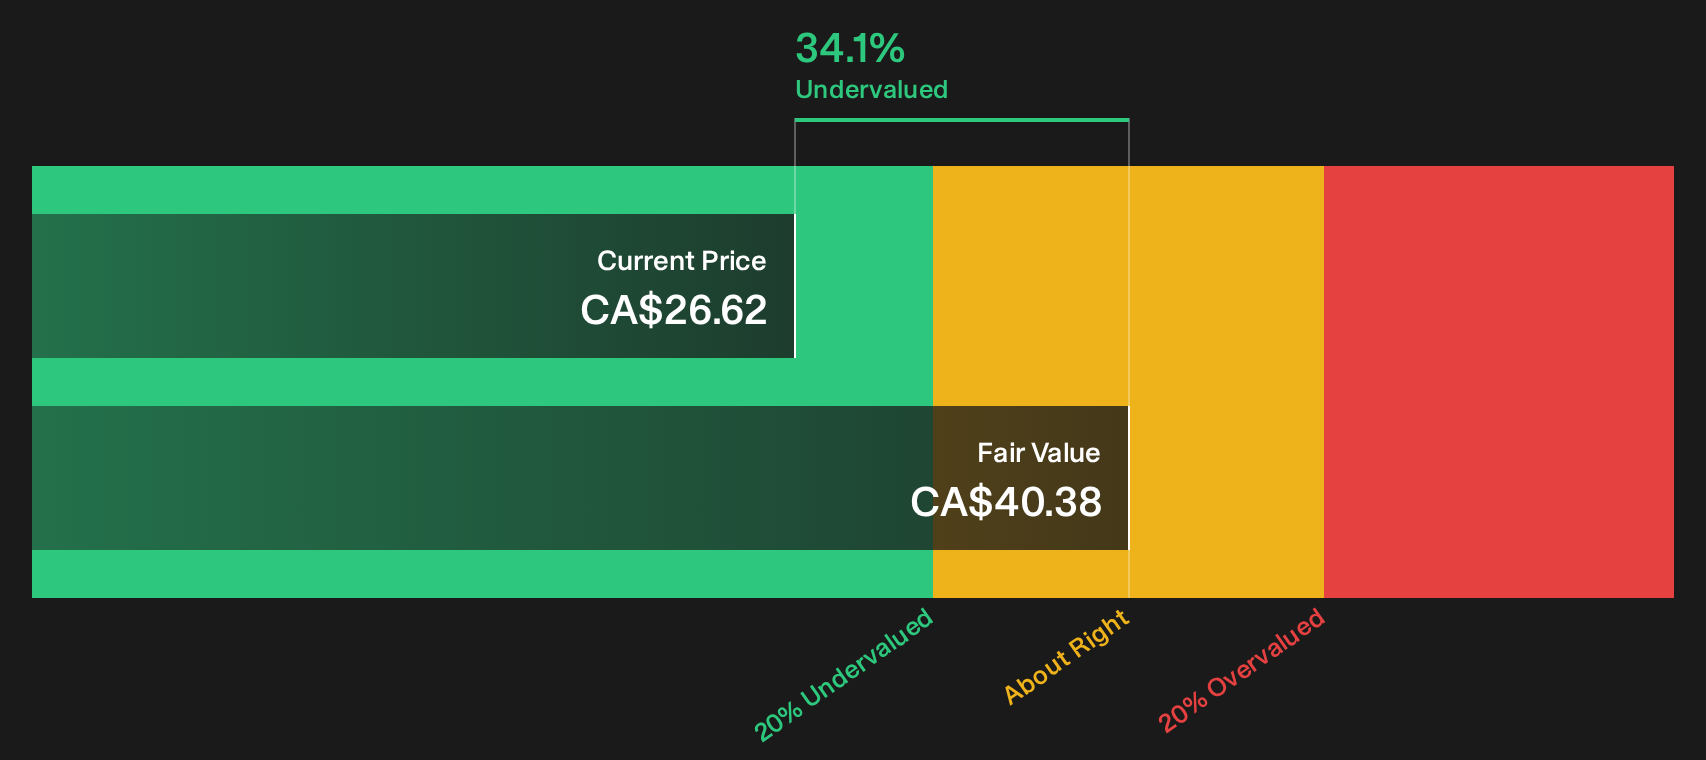
Simply Wall St performs a discounted cash flow (DCF) on every stock in the world every day (check out SmartCentres Real Estate Investment Trust for example). We show the entire calculation in full. You can track the result in your watchlist or portfolio and be alerted when this changes, or use our stock screener to discover 5 high quality undervalued stocks. If you save a screener we even alert you when new companies match - so you never miss a potential opportunity.
Next Steps
Mixed signals on SmartCentres Real Estate Investment Trust can easily pull you in opposite directions, so move fast on doing your own homework and stress testing the assumptions that matter to you. Start with the 2 key rewards and 4 important warning signs.
Looking for more investment ideas beyond SmartCentres Real Estate Investment Trust?
If SmartCentres Real Estate Investment Trust has you thinking more broadly about income, risk and value, now is the moment to widen your opportunity set with a focused search.
- Target resilient cash generators and focus on balance sheet strength with a curated list of solid balance sheet and fundamentals (7 results) that filters for sturdier fundamentals.
- Hunt for value and zero in on companies that combine quality metrics with attractive pricing using the 5 high quality undervalued stocks tailored for bargain seekers.
- Prioritise steady income and compare higher yielding options through a purpose built 1 dividend fortresses that spotlights stronger, cash focused distributions.
This article by Simply Wall St is general in nature. We provide commentary based on historical data and analyst forecasts only using an unbiased methodology and our articles are not intended to be financial advice. It does not constitute a recommendation to buy or sell any stock, and does not take account of your objectives, or your financial situation. We aim to bring you long-term focused analysis driven by fundamental data. Note that our analysis may not factor in the latest price-sensitive company announcements or qualitative material. Simply Wall St has no position in any stocks mentioned.
Have feedback on this article? Concerned about the content? Get in touch with us directly. Alternatively, email editorial-team@simplywallst.com