
- PRICING
- LIVE QUOTES
- LEARN
- HELP


EN
Jefferies Financial Group (JEF) Issues New Bonds, Does The Stock Look Fairly Valued?
Jefferies Financial Group (JEF) has just come to market with a trio of new bonds, adding fresh fixed and floating rate debt ahead of its Q3 2026 earnings release on September 28.
Those fresh bonds arrive after a choppy stretch for Jefferies Financial Group’s equity, with the share price at US$47.68 after a 1-day share price return of 3.11%, but down 10.19% over 30 days and 24.87% year to date. At the same time, the 3-year total shareholder return of 44.75% and 5-year total shareholder return of 52.91% point to a stronger longer-term record.
Scan beyond Jefferies Financial Group and identify other beaten-down plays with resilient fundamentals using our curated 32 high quality undervalued stocks, while this bond issuance keeps fixed income attention on the sector.
Jefferies Financial Group now trades at a modest discount to both analyst targets and one intrinsic value estimate after a sharp share price reset. Is that caution a warning sign or a mispriced opportunity on recent results and bond moves?
Price-to-Earnings of 13.7x: Is it justified?
Jefferies Financial Group now trades on a P/E of 13.7x, which looks restrained when set against its recent share reset and the broader capital markets peer group.
The P/E ratio compares what investors pay today for each dollar of earnings. For a capital markets platform like Jefferies Financial Group that generates fee-based income across investment banking, trading and asset management, this yardstick helps you see how the market is weighing its current profit engine against listed rivals.
On the numbers, the stock changes hands at a P/E of 13.7x compared with a US Capital Markets industry average of 39.4x and a peer average of 27.4x. The estimated fair P/E for Jefferies Financial Group sits at 15.2x, which is higher than where the market is currently pricing it and could be a level the valuation converges toward if earnings and sentiment align with that fair ratio framework.
Explore the SWS fair ratio for Jefferies Financial Group.
Result: Price-to-Earnings of 13.7x (UNDERVALUED)
Still, Jefferies Financial Group faces deal volume risk in investment banking and relies heavily on Americas revenue concentration, both of which could unsettle that valuation story.
Find out about the key risks to this Jefferies Financial Group narrative.
Another View: Jefferies Financial Group Through A Cash Flow Lens
That P/E gap is only one angle. The SWS DCF model values Jefferies Financial Group at $48.60 a share, only about 1.9% above the recent $47.68 price, which points to the stock trading close to estimated fair value rather than being deeply mispriced. If earnings forecasts or discount rate assumptions shift, that slim margin could move quickly in either direction for holders.
Look into how the SWS DCF model arrives at its fair value.
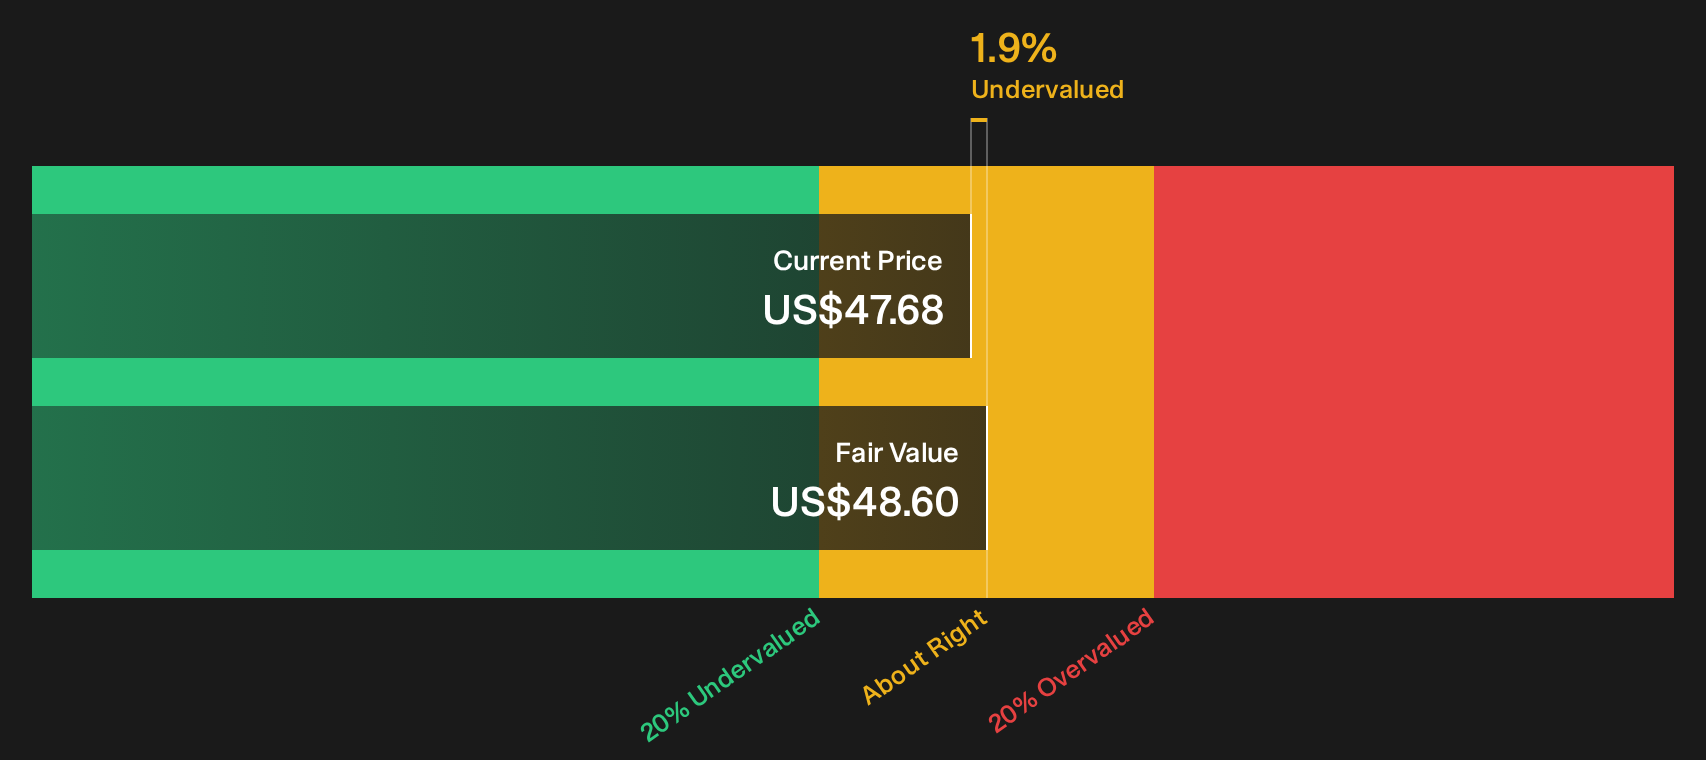
Simply Wall St performs a discounted cash flow (DCF) on every stock in the world every day (check out Jefferies Financial Group for example). We show the entire calculation in full. You can track the result in your watchlist or portfolio and be alerted when this changes, or use our stock screener to discover 32 high quality undervalued stocks. If you save a screener we even alert you when new companies match - so you never miss a potential opportunity.
Next Steps
Uncertain whether the market’s caution around Jefferies Financial Group is justified or exaggerated? Move quickly, review the same valuation drivers, then weigh those 5 key rewards
Ready for more investment ideas beyond Jefferies Financial Group?
Do not stop with Jefferies Financial Group. Use the screener to spot fresh setups, compare quality, and build a watchlist before the market focuses on the same opportunities.
- Target established businesses with low expectations baked into prices by running through the 32 high quality undervalued stocks.
- Zero in on companies that prioritize balance sheet strength and fundamentals using the list of solid balance sheet and fundamentals (24 results).
- Hunt for overlooked opportunities that still show solid quality traits through the 16 high quality undiscovered gems.
This article by Simply Wall St is general in nature. We provide commentary based on historical data and analyst forecasts only using an unbiased methodology and our articles are not intended to be financial advice. It does not constitute a recommendation to buy or sell any stock, and does not take account of your objectives, or your financial situation. We aim to bring you long-term focused analysis driven by fundamental data. Note that our analysis may not factor in the latest price-sensitive company announcements or qualitative material. Simply Wall St has no position in any stocks mentioned.
Have feedback on this article? Concerned about the content? Get in touch with us directly. Alternatively, email editorial-team@simplywallst.com