
- PRICING
- LIVE QUOTES
- LEARN
- HELP


EN
Crude Oil at a Crossroads: Will Hormuz Diplomacy Break the $95 Ceiling?
War, Diplomacy, and the Fed: What's Really Driving Crude Right Now
Crude oil sentiment remains dominated by the ongoing Iran war, now in its seventh month, and specifically by the fate of the Strait of Hormuz. On September 23, a senior Iranian official said Tehran could reopen the strait within a week if the United States eases military pressure and lifts its naval blockade of Iranian ports, a proposal that revived hopes for a diplomatic path out of the conflict. By September 24, Iran had reportedly presented Washington with a written roadmap calling for a regionwide ceasefire of up to 60 days and a phased reopening of the strait. That diplomatic progress is the direct catalyst behind Friday's pullback, as WTI eased toward $92 amid reports that US and Iranian negotiators were exploring a phased agreement to restore transit through the waterway. At the same time, physical supply remains in a state of repair rather than full disruption. Saudi Arabia's East West pipeline, a 1,200 kilometer conduit with nameplate capacity of 7 million barrels per day that had been rerouting around 4 million barrels daily to bypass Hormuz, was shut down after drone strikes hit it on September 10 and 11. The kingdom restarted the line on September 22 and resumed crude loadings at Yanbu, though at a reduced rate, and Aramco is working to bring the pumping rate back toward its prior 4 million barrel per day level. Full restoration to the pipeline's 7 million barrel nameplate capacity could still take up to six weeks, since three damaged pumping stations require repair even as the remaining eight keep reduced volumes moving through temporary bypass sections. The restart itself acted as a bearish catalyst in the days that followed, contributing to Brent's slide below $100 and WTI's drop toward $89.50 in the second half of the week.
Macro forces are adding another layer. On September 16, the Federal Reserve raised its benchmark rate by 25 basis points to 3.75% to 4.00% in a unanimous vote, its first hike since 2023, citing a resilient labor market, sticky inflation, and the ongoing energy shock from the Iran war. The move firmed up the dollar and reinforced a higher for longer rate narrative. Inventory data has been mixed as well. The latest EIA weekly report, for the week ended September 18, showed US commercial crude stocks built by 3.0 million barrels to 426.4 million barrels, ending three straight weekly declines, while distillate stocks fell further to about 12% below their five year average and the Strategic Petroleum Reserve sits at its lowest level since 1982. That diesel side tightness continues to be described as a genuine fuel crunch layered on top of the crude story.
What the Market Has Done
- Since July 2026, the market has trended higher inside an ascending channel, moving off the lows around 70 and printing a sequence of higher highs and higher lows along the way.
- From there, price pushed up through the 95 area (Minor Level 1) and extended further to 105 (Daily Level 2), marking the upper boundary of the current advance.
- More recently, however, the market has retraced back down through Minor Level 1, and sellers now appear to be stepping down their offers to that level, effectively converting prior support into a lid on any near term bounce.
- This entire advance has unfolded against a backdrop of an unresolved regional conflict that repeatedly threatened to choke off physical supply, which helped sustain a persistent geopolitical risk premium even as headline diplomacy ebbed and flowed. As that premium builds and unwinds in cycles, it has produced the kind of stair step, higher high structure now visible on the chart, rather than a smooth, one directional move.
What to Expect in the Coming Weeks
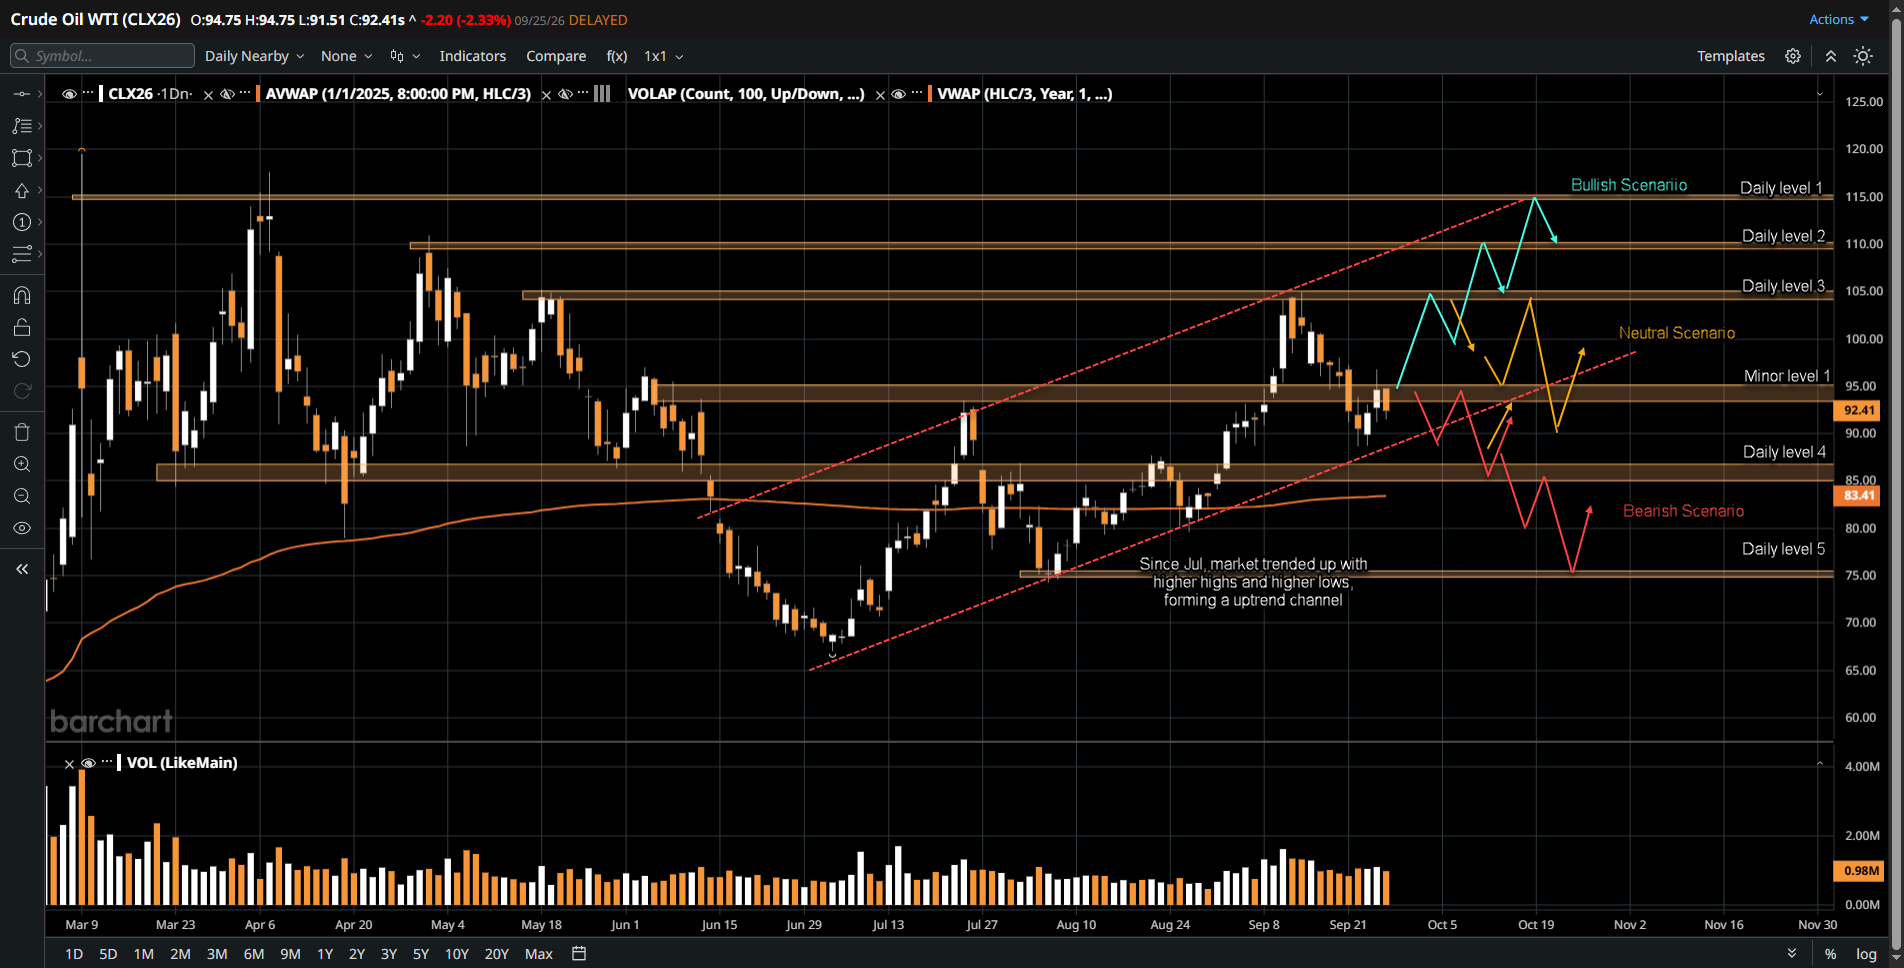
The key levels to watch are the 95 area (Minor Level 1), 105 (Daily Level 2), and 86 (Daily Level 3).
Bullish Scenario:
- If buyers are able to reclaim back above the 95 area, expect a rotation back up towards 105, though some responsive selling is likely there as well.
- If the market is instead able to accept above 110 (Daily Level 1), expect continuation up toward 115, an area that may be confluent with the projected top of the ascending channel.
- A possible trigger for this scenario is a breakdown in the current US Iran talks or a fresh attack on Gulf energy infrastructure that further delays the reopening of Hormuz or the East West pipeline.
Neutral Scenario:
- If sellers respond at 105 on an up rotation, and/or buyers respond at 86, expect a balanced, two way rotation between these two levels as the market works to reestablish value.
- A possible supporting condition for this scenario is a partial, incomplete resolution to the Hormuz standoff, one that reduces immediate supply fears without fully removing the underlying geopolitical risk premium.
Bearish Scenario:
- If sellers hold down at the 95 area and prevent prices from reclaiming above it, expect a move down to the 86 area, where buyers are expected to step in and defend.
- If buyers fail to defend 86, expect a further move down below that level toward 75 (Daily Level 5).
- A possible trigger for this scenario is a confirmed, durable ceasefire that reopens Hormuz to a majority of pre-war flow, paired with the East West pipeline returning to service ahead of expectations.
Conclusion
Crude oil sits at a genuinely two-sided moment. On the technical side, the retracement through Minor Level 1 at 95 is the level to watch this week, since holding it as resistance would favor sellers while reclaiming it would reopen the path back toward 105 and beyond. On the fundamental side, the outcome of US Iran negotiations over Hormuz, the pace of repairs to the East West pipeline, and the Fed's higher for longer rate stance are all pulling in different directions at once. Watch the development of the Hormuz talks closely in the days ahead, since a durable resolution there would likely matter more to price than any single technical level on the chart.
EdgeClear is designed for traders who refuse to guess. We deliver unfiltered tick data via Rithmic, competitive pricing starting at $0.22 per side, and performance analytics that transform your trade log into a roadmap. The serious trader’s next move is clear. Open an Account today.
Disclaimer:
This article is provided for informational and educational purposes only and does not constitute financial, investment, or trading advice. The analysis presented reflects the author’s market observations and opinions at the time of writing and is not a recommendation to buy or sell any futures contract, security, or financial instrument. Futures trading involves significant risk and is not suitable for all market participants. Losses may exceed initial margin deposits, and market conditions can change rapidly.
Any scenarios, levels, or market expectations discussed are hypothetical in nature and are intended solely to illustrate potential market behavior. They do not represent actual trading results and should not be interpreted as guarantees of future performance. Past performance, market behavior, or historical price action are not indicative of future outcomes.
Readers are solely responsible for their own trading decisions and risk management. Always conduct independent research, consider your financial situation and risk tolerance, and consult with a qualified financial professional, if necessary, before engaging in futures or derivatives trading.