
- PRICING
- LIVE QUOTES
- LEARN
- HELP


EN
Morningstar (MORN) Holds Its Dividend As The Undervalued Narrative Faces A Fresh Test
Morningstar (MORN) has affirmed a quarterly cash dividend of $0.50 per share, matching its July payout. The distribution is scheduled for October 30, 2026, to shareholders of record on October 2.
Recent trading has been choppy for Morningstar, with the share price down almost 10% over the past month after a strong 90-day share price return of about 26%. However, the 1-year total shareholder return is lower, suggesting momentum has cooled despite the steady dividend signal from management.
Scan for other resilient income ideas beyond Morningstar in our curated list of 8 dividend fortresses while dividend headlines are driving the story.
Morningstar has rallied hard over 90 days, then given back a chunk of that move while the dividend line stays flat. Does that wobble leave enough upside to justify the risk from here, once the valuation work starts?
Most Popular Narrative: 17% Undervalued
Morningstar last closed at $195.98 while the most followed narrative pegs fair value closer to $236.67, so the gap between price and that framework is doing the heavy lifting in this story.
The integration of PitchBook private market data into AI platforms such as ChatGPT for Financial Services and Gemini Enterprise for Financial Services creates new data licensing and workflow subscription opportunities that can support higher revenue per user and improved margins as distribution scales.
Lumonic 12.0 and the MCP server that connects portfolio data to leading AI assistants point to deeper adoption of AI driven portfolio monitoring tools, which can expand Morningstar’s addressable spend with private market clients and support future revenue growth.
See why 1 investors see Morningstar as 17% undervalued.
Result: Fair Value of $236.67 (UNDERVALUED)
Still, the Morningstar story can break if AI tools like Lumonic 12.0 fail to win paying users, or if ongoing insider selling keeps sentiment under pressure.
Find out about the key risks to this Morningstar narrative.
Another View on Morningstar’s Value
There is a different lens on Morningstar once the SWS DCF model is brought into the picture. At $195.98 the stock is described as trading above an estimated future cash flow value of $160.41, which frames the shares as expensive rather than cheap on this measure.
That gap puts more of the burden on execution. If cash flows do not build as expected, the premium over the DCF estimate gives less room for error, so how comfortable are you relying on the analyst target instead of the cash flow math?
Look into how the SWS DCF model arrives at its fair value.
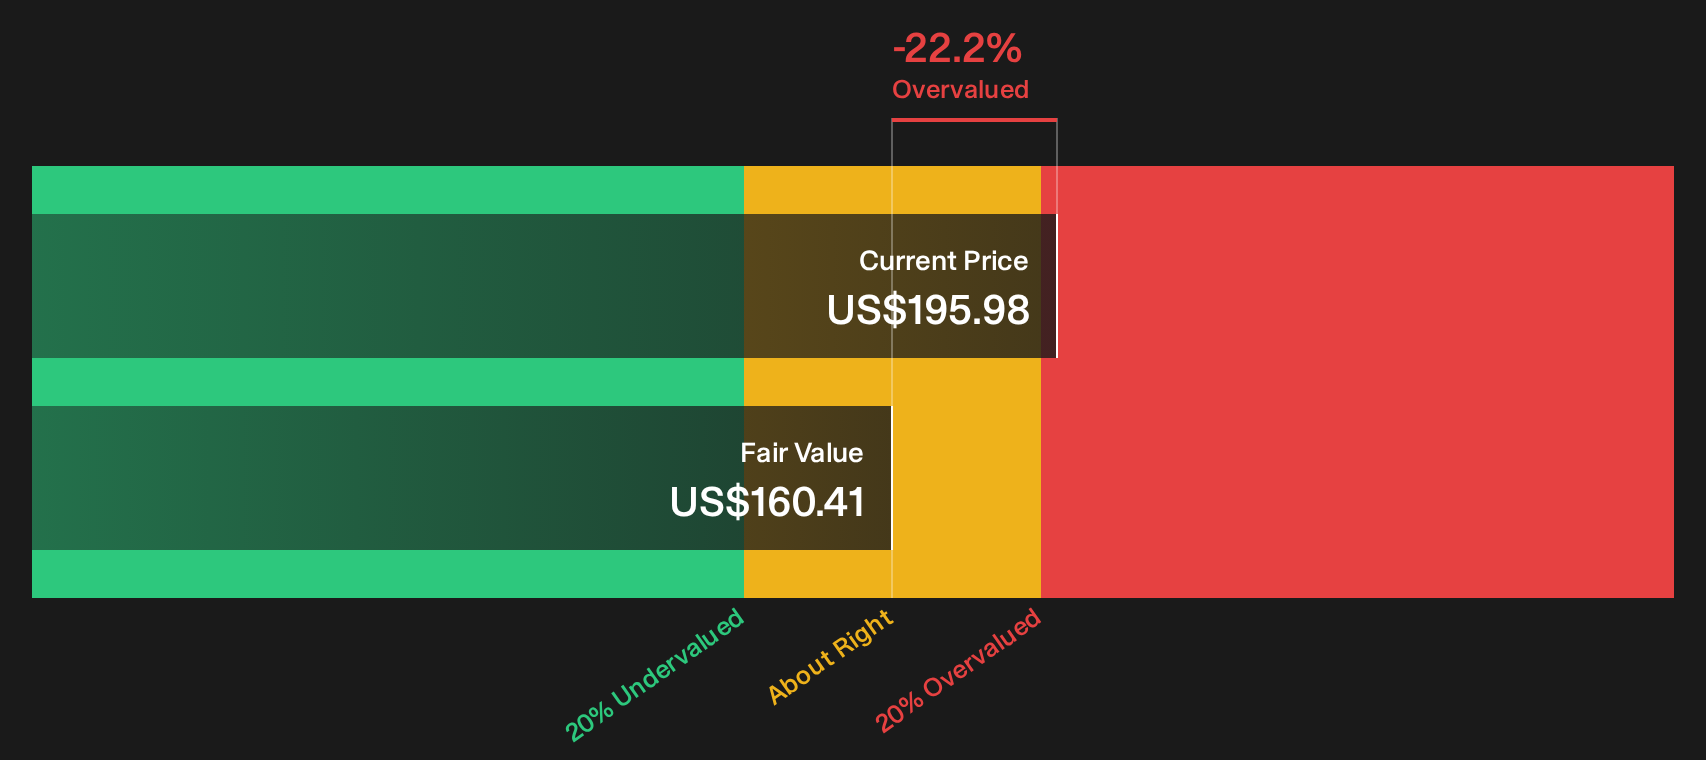
Simply Wall St performs a discounted cash flow (DCF) on every stock in the world every day (check out Morningstar for example). We show the entire calculation in full. You can track the result in your watchlist or portfolio and be alerted when this changes, or use our stock screener to discover 32 high quality undervalued stocks. If you save a screener we even alert you when new companies match - so you never miss a potential opportunity.
Next Steps
Mixed signals around Morningstar’s valuation and dividend profile are hard to ignore, so treat this as a prompt to move fast and pressure test the story against your own assumptions using the 4 key rewards and 1 important warning sign.
Looking for more Morningstar investment ideas?
Morningstar is only one piece of your portfolio, so widen your lens now and scan other opportunities before the next wave of headlines reshapes the opportunity set.
- Target stability first by reviewing companies with resilient balance sheets and solid fundamentals through this focused list of solid balance sheet and fundamentals (24 results).
- Hunt for quality at a potential discount by filtering for strong businesses where price may lag fundamentals using the 32 high quality undervalued stocks.
- Spot early movers with compelling stories by screening for smaller opportunities that pass tougher filters in the 16 high quality undiscovered gems.
This article by Simply Wall St is general in nature. We provide commentary based on historical data and analyst forecasts only using an unbiased methodology and our articles are not intended to be financial advice. It does not constitute a recommendation to buy or sell any stock, and does not take account of your objectives, or your financial situation. We aim to bring you long-term focused analysis driven by fundamental data. Note that our analysis may not factor in the latest price-sensitive company announcements or qualitative material. Simply Wall St has no position in any stocks mentioned.
Have feedback on this article? Concerned about the content? Get in touch with us directly. Alternatively, email editorial-team@simplywallst.com