
- PRICING
- LIVE QUOTES
- LEARN
- HELP


EN
Japan Airlines (TSE:9201) Gains Momentum, Is The Stock Still Undervalued?
Japan Airlines (TSE:9201) has attracted fresh attention after its shares closed at ¥3,096 on the most recent trading day. This has prompted investors to reassess the carrier’s recent returns and core financial profile.
Over the past few months, Japan Airlines has seen a steady build in momentum, with an 8.04% 90 day share price return and a 5.07% year to date share price return, while long term holders have a 31.03% five year total shareholder return.
Scan other transport and travel operators showing similar momentum by checking our hand picked list of 19 high quality undervalued stocks along with Japan Airlines.
That recent climb in Japan Airlines, combined with its current price near ¥3,096, leaves a simple tension. Do the fundamentals still justify taking on fresh risk at this level, or has the easy upside already been claimed?
Price-to-Earnings of 11.9x: Is it justified?
On simple earnings maths, Japan Airlines looks modestly priced. The shares last closed at ¥3,096 while the stock is on a P/E of 11.9x that screens as inexpensive against several benchmarks.
The P/E ratio compares what investors pay for each ¥1 of current earnings. For an airline that already reports profits and operates a large fleet across Japan, Asia, Oceania, the US and Europe, that earnings based yardstick is a useful shorthand for how the market is weighing its current profit engine.
Relative value flags come through clearly. Japan Airlines trades on a P/E of 11.9x, which the data shows is below the broader JP market on 14.1x, below the Asian Airlines industry on 13.9x, and well under the listed peer average on 27.4x. The estimated fair P/E of 18.4x also sits well above the current multiple, which points to a level the valuation could move toward if sentiment on the business and its earnings profile shifted closer to those benchmarks.
Explore the SWS fair ratio for Japan Airlines.
Result: Price-to-Earnings of 11.9x (UNDERVALUED)
Still, the Japan Airlines story can change quickly if fuel costs spike or if demand on key international routes softens, which could pressure earnings and valuation.
Find out about the key risks to this Japan Airlines narrative.
Another View on Japan Airlines’ Valuation
The picture shifts once the SWS DCF model is brought in. On that cash flow view, Japan Airlines at ¥3,096 trades well above an estimated future cash flow value of ¥1,556. That screen reads as overvalued on this metric. So which yardstick should carry more weight for you right now?
Look into how the SWS DCF model arrives at its fair value.
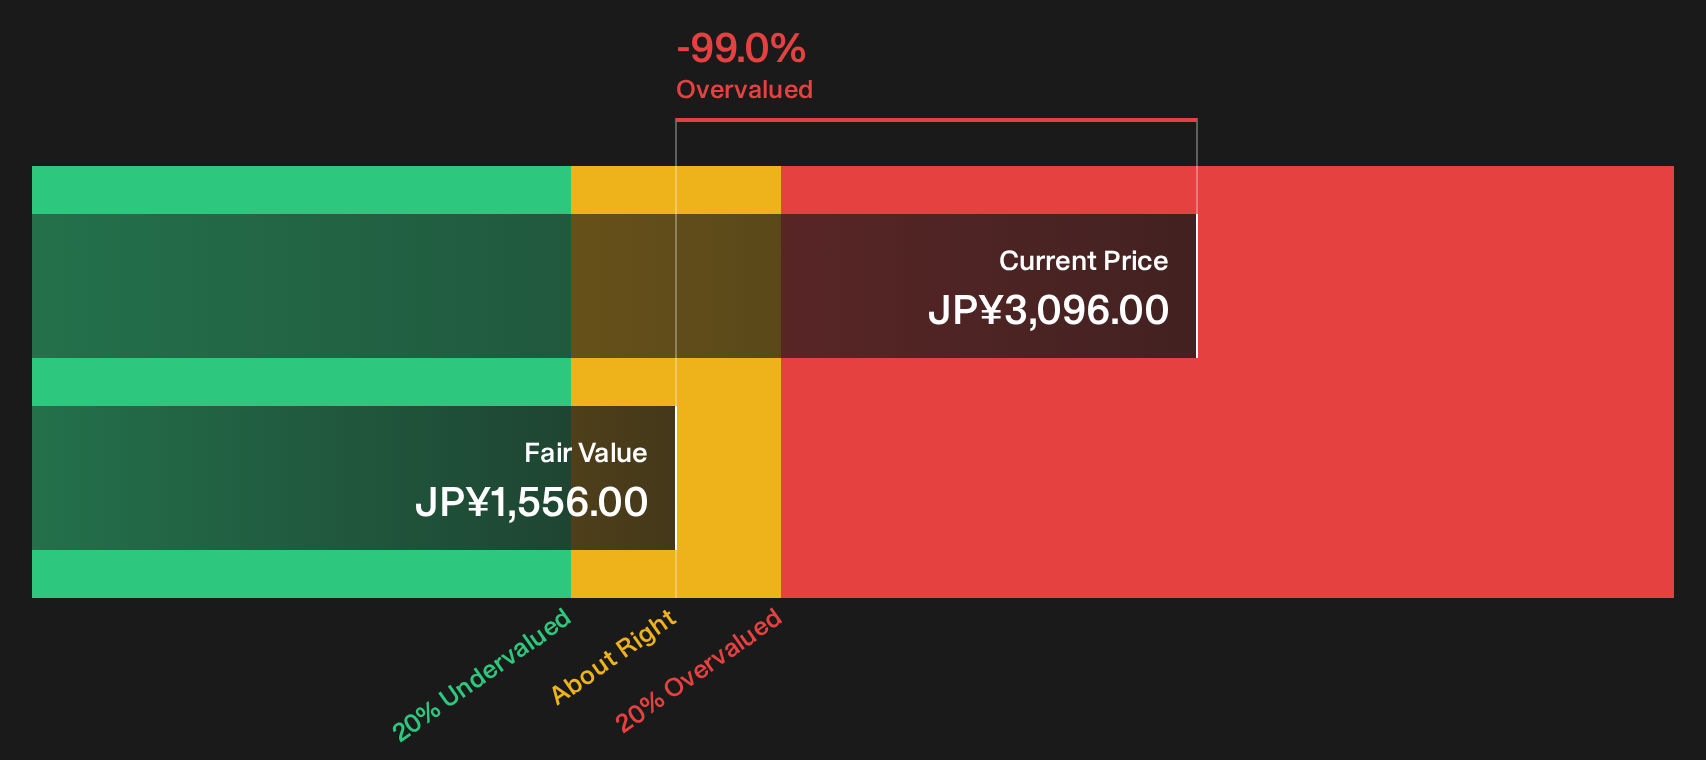
Simply Wall St performs a discounted cash flow (DCF) on every stock in the world every day (check out Japan Airlines for example). We show the entire calculation in full. You can track the result in your watchlist or portfolio and be alerted when this changes, or use our stock screener to discover 19 high quality undervalued stocks. If you save a screener we even alert you when new companies match - so you never miss a potential opportunity.
Next Steps
Feeling mixed about Japan Airlines after all that data and valuation work? Act while the details are fresh, stress test the thesis against your own expectations, then weigh up the 3 key rewards and 1 important warning sign.
Want more ideas beyond Japan Airlines?
If Japan Airlines has you thinking harder about valuation and risk, keep that energy going by widening your watchlist with a few targeted stock ideas.
- Target dependable cash generators by reviewing companies that screen as resilient, using the 21 resilient stocks with low risk scores to focus on businesses with steadier profiles.
- Spot potential mispricings early and scan the 74 high quality undiscovered gems so you are not the last to hear about under followed opportunities with solid fundamentals.
- Strengthen your portfolio’s foundation and filter for financially robust operators through the list of solid balance sheet and fundamentals (22 results) before the crowd catches on.
This article by Simply Wall St is general in nature. We provide commentary based on historical data and analyst forecasts only using an unbiased methodology and our articles are not intended to be financial advice. It does not constitute a recommendation to buy or sell any stock, and does not take account of your objectives, or your financial situation. We aim to bring you long-term focused analysis driven by fundamental data. Note that our analysis may not factor in the latest price-sensitive company announcements or qualitative material. Simply Wall St has no position in any stocks mentioned.
Have feedback on this article? Concerned about the content? Get in touch with us directly. Alternatively, email editorial-team@simplywallst.com