
- PRICING
- LIVE QUOTES
- LEARN
- HELP


EN
M3 (TSE:2413) Climbed, So What Is Drawing Fresh Attention?
Activist push puts M3’s direction in focus
Oasis Management’s activist engagement with M3 (TSE:2413) has moved into high gear, with proposals touching management control, potential delisting, capital policy shifts, and the possibility of a third party securing majority voting rights.
M3’s recent 2.14% 1 day share price gain to ¥1,767.5 comes after a run where the share price return is down 14.72% year to date, and the 5 year total shareholder return has fallen 76.72%, signaling long term pressure while short term momentum is tentative.
Compare how other healthcare and tech enabled platforms under pressure are priced by reviewing the hand picked 19 high quality undervalued stocks alongside M3.
Bulls see Oasis pressure forcing value out of a profitable M3 franchise, while bears read the activism and long slide as a warning. Which story do the current numbers lean toward as you weigh what the shares are worth?
Preferred P/E of 25.5x on M3: Is it justified?
M3 closed at ¥1,767.5 while trading on a P/E of 25.5x, and the share price is described as 6.5% below an internal fair value estimate and below an SWS DCF value of ¥1,890.33. This points to a market that is not uniformly pricing the business.
The P/E ratio compares what investors pay for each unit of current earnings. A 25.5x multiple means the market is paying ¥25.5 for every ¥1 of profit that M3 generates. For an online healthcare services platform with a wide set of revenue lines, that metric gives a quick sense of how investors weigh its ability to convert digital reach into sustainable earnings.
M3 is described as having high quality earnings and earnings that are forecast to grow 11.9% per year, which is faster than the 9.1% annual earnings growth expected for the broader JP market. That earnings outlook is not described as "significant" because it sits below the 20% threshold. A P/E above many domestic peers suggests investors are still willing to pay up for steadier income growth rather than aggressive expansion.
Compared with the Asian Healthcare Services industry average P/E of 19.6x, M3 is flagged as expensive. It is also described as good value relative to a peer average P/E of 27.4x and to an estimated fair P/E of 27.4x. Taken together, that indicates the stock trades at a premium to the broader sector while sitting at a discount to the level some models suggest the multiple could move toward if its earnings profile and cash flow strength stay aligned with expectations.
Explore the SWS fair ratio for M3.
Result: Price-to-Earnings of 25.5x (ABOUT RIGHT)
Still, activist pressure could reshape M3’s capital allocation or even its listing status, and its long multi year share price slide may keep confidence fragile.
Find out about the key risks to this M3 narrative.
Another view on M3’s value
Price based models paint one picture of M3. A different lens comes from the SWS DCF model, which puts future cash flow value at ¥1,890.33 versus today’s ¥1,767.5. That gap suggests the cash flows imply more value than the current P/E alone, so which signal carries more weight for you?
Look into how the SWS DCF model arrives at its fair value.
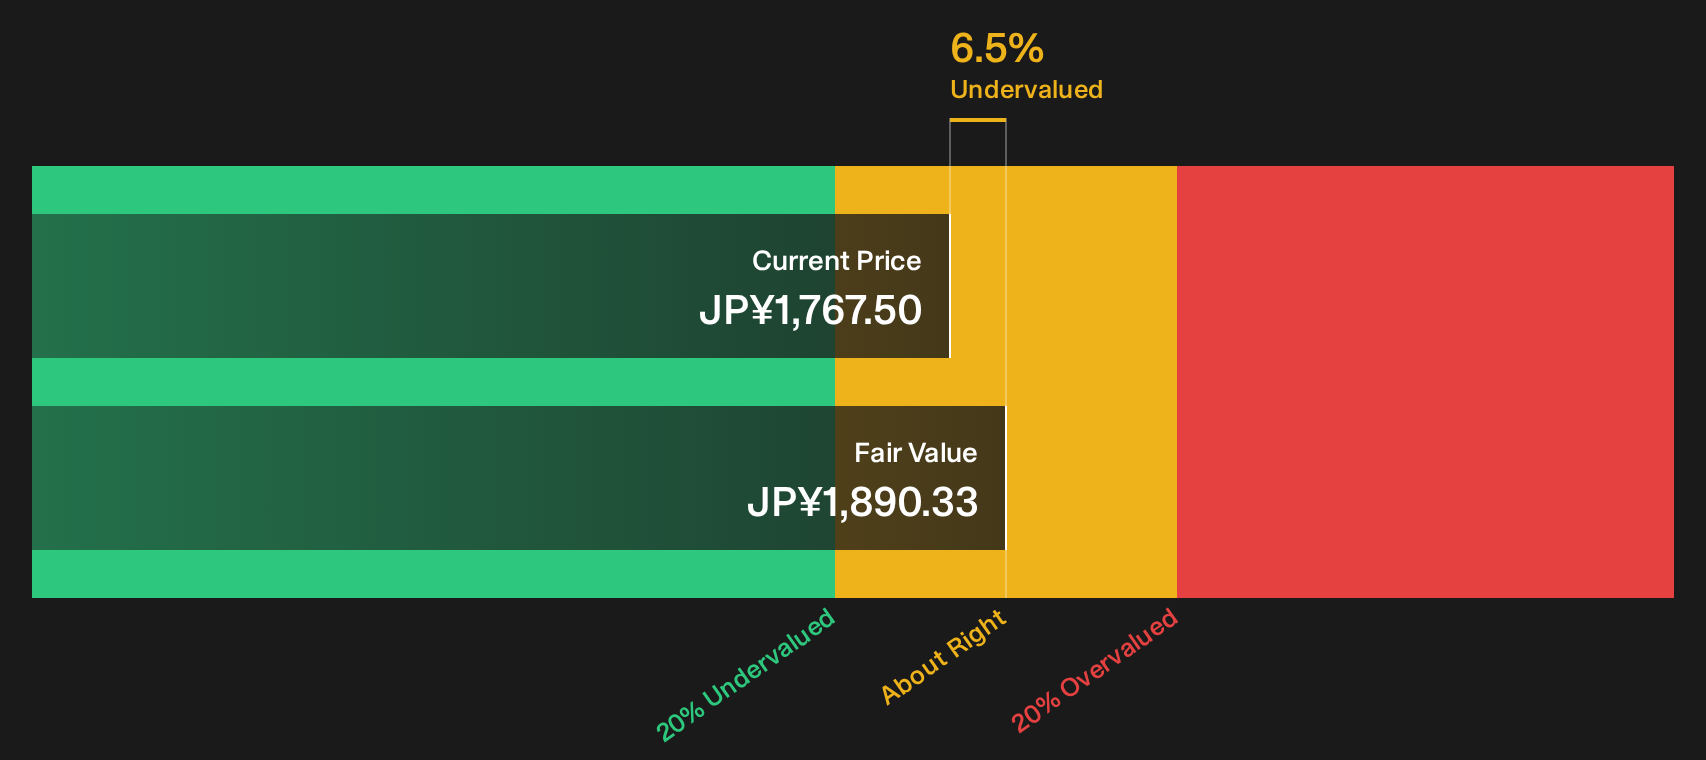
Simply Wall St performs a discounted cash flow (DCF) on every stock in the world every day (check out M3 for example). We show the entire calculation in full. You can track the result in your watchlist or portfolio and be alerted when this changes, or use our stock screener to discover 19 high quality undervalued stocks. If you save a screener we even alert you when new companies match - so you never miss a potential opportunity.
Next Steps
Mixed signals around M3 can feel messy, so move fast, review the core data, and weigh both the potential upside and the red flags. To see those side by side, including the 1 risk and 1 reward that investors keep circling back to, start with the 2 key rewards and 1 important warning sign
Looking for more investment ideas beyond M3?
If M3 has your attention but you want a wider watchlist, use the Screener to quickly surface fresh ideas that fit your risk and return preferences.
- Target potential mispricing and compare against M3 by scanning a curated pool of companies trading below their estimated worth using the 19 high quality undervalued stocks.
- Prioritize resilience first and returns second by filtering for businesses with strong finances through the list of solid balance sheet and fundamentals (22 results).
- Hunt for overlooked opportunities that larger investors may not be watching yet by checking out the 74 high quality undiscovered gems.
This article by Simply Wall St is general in nature. We provide commentary based on historical data and analyst forecasts only using an unbiased methodology and our articles are not intended to be financial advice. It does not constitute a recommendation to buy or sell any stock, and does not take account of your objectives, or your financial situation. We aim to bring you long-term focused analysis driven by fundamental data. Note that our analysis may not factor in the latest price-sensitive company announcements or qualitative material. Simply Wall St has no position in any stocks mentioned.
Have feedback on this article? Concerned about the content? Get in touch with us directly. Alternatively, email editorial-team@simplywallst.com