
- PRICING
- LIVE QUOTES
- LEARN
- HELP


EN
Yamaichi ElectronicsLtd (TSE:6941) Plans New Philippines Factory, Is The Stock A Bargain?
Yamaichi ElectronicsLtd (TSE:6941) has approved construction of a new Factory 4 in the Philippines, a ¥6.5b project that expands semiconductor test socket and connector production capacity for multiple end markets.
Recent trading has been strong, with Yamaichi ElectronicsLtd’s share price gaining 6.73% over the past week and 9.04% over the past month. However, the 90 day share price return is down 11.57% after a rapid year to date climb of 45.58%.
Scan beyond Yamaichi ElectronicsLtd and compare this expansion story with 85 AI infrastructure stocks powering the surge in semiconductor, data center, and AI server demand.
Yamaichi ElectronicsLtd now sits between two clear interpretations. Recent gains can be read as the market finally catching up to the expansion story, or as sentiment running ahead of what the cash flows support next.
Price-to-Earnings of 14.9x for Yamaichi ElectronicsLtd: Is it justified?
Valuation on simple earnings terms looks supportive for Yamaichi ElectronicsLtd, with a P/E of 14.9x at a last close of ¥8,560 that points to a lower earnings multiple than both peers and the wider semiconductor group.
The P/E ratio compares what investors pay today for each unit of current earnings. For a chip related hardware supplier like Yamaichi ElectronicsLtd, it often reflects how the market weighs current profitability against expected demand for sockets, connectors, and optical components across communications, automotive, medical, and industrial equipment customers.
A 14.9x P/E that sits below the estimated fair P/E of 20.7x suggests the market is assigning a more cautious tag to those earnings than the fair ratio model implies. That sits alongside several quality markers, including high quality earnings, a 21.6% Return on Equity and net profit growth of 119.1% over the past year, plus forecast annual profit growth of 8.21% and revenue growth of 11.1%.
Relative to the sector, the gap is even clearer. The current P/E of 14.9x is well under the JP semiconductor industry average of 21.9x and slightly below the peer group average of 15.1x. This suggests the market is pricing Yamaichi ElectronicsLtd more conservatively than both its direct competitors and the broader industry level that fair value models indicate it could move toward.
Explore the SWS fair ratio for Yamaichi ElectronicsLtd.
Result: Price-to-Earnings of 14.9x (UNDERVALUED)
Still, the narrative can crack if semiconductor capital spending softens or if Yamaichi Electronics Ltd struggles to keep factory expansion aligned with actual order trends.
Find out about the key risks to this Yamaichi ElectronicsLtd narrative.
Another View on Yamaichi ElectronicsLtd’s Value
A different lens tells a less generous story. Our DCF model values Yamaichi ElectronicsLtd’s future cash flows at ¥7,544.85 per share, which sits below the current ¥8,560 price and points to the stock trading rich on that measure. Which signal do you treat as the anchor?
Look into how the SWS DCF model arrives at its fair value.
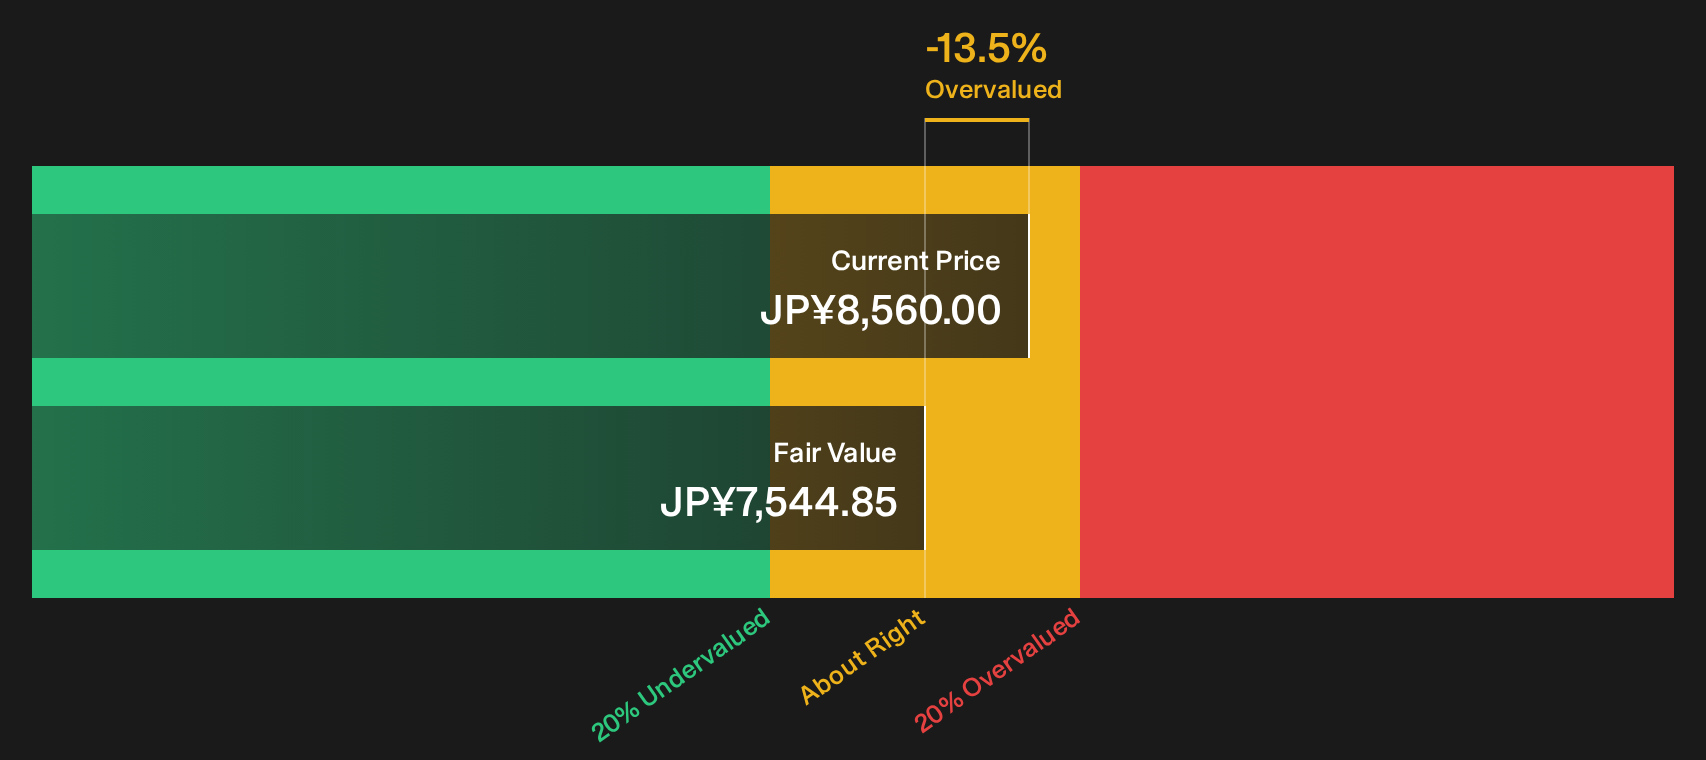
Simply Wall St performs a discounted cash flow (DCF) on every stock in the world every day (check out Yamaichi ElectronicsLtd for example). We show the entire calculation in full. You can track the result in your watchlist or portfolio and be alerted when this changes, or use our stock screener to discover 19 high quality undervalued stocks. If you save a screener we even alert you when new companies match - so you never miss a potential opportunity.
Next Steps
Mixed signals on Yamaichi ElectronicsLtd so far. Act while the details are fresh and weigh the potential upside against the red flags by checking the 4 key rewards and 2 important warning signs
Looking for more investment ideas beyond Yamaichi ElectronicsLtd?
If Yamaichi ElectronicsLtd has caught your attention, do not stop with a single opportunity. Use screeners to uncover fresh ideas before others catch on.
- Hunt for quality at a discount by scanning our 19 high quality undervalued stocks, which filters for strong fundamentals at prices the market may be underappreciating.
- Build a steadier portfolio by reviewing the 21 resilient stocks with low risk scores, which highlights companies with more resilient risk profiles and financial strength.
- Spot future contenders early by checking the 74 high quality undiscovered gems, which surfaces businesses with solid numbers but limited current attention.
This article by Simply Wall St is general in nature. We provide commentary based on historical data and analyst forecasts only using an unbiased methodology and our articles are not intended to be financial advice. It does not constitute a recommendation to buy or sell any stock, and does not take account of your objectives, or your financial situation. We aim to bring you long-term focused analysis driven by fundamental data. Note that our analysis may not factor in the latest price-sensitive company announcements or qualitative material. Simply Wall St has no position in any stocks mentioned.
Have feedback on this article? Concerned about the content? Get in touch with us directly. Alternatively, email editorial-team@simplywallst.com