
- PRICING
- LIVE QUOTES
- LEARN
- HELP


EN
U-NEXT HOLDINGS Ltd (TSE:9418) Could Be 22% Above Fair Value Following Index Removal
Index removal puts U-NEXT HOLDINGSLtd in focus
U-NEXT HOLDINGSLtd (TSE:9418) was removed from the FTSE All-World Index (USD) on 19 September 2026, a move that can prompt forced selling by index-tracking funds and increase focus on the company’s fundamentals.
Recent trading shows U-NEXT HOLDINGS Ltd shares trying to regain ground, with a 90-day share price return of 13.8% and a 7-day move of 2.16%, even though the year-to-date share price return is down 9.65% and the 1-year total shareholder return has declined 15.46%.
Compare how U-NEXT HOLDINGSLtd's recent index exit stacks up against other potential opportunities by scanning our hand-picked 74 high quality undiscovered gems in similar market situations.
U-NEXT HOLDINGS Ltd runs a broad entertainment and services franchise, yet the index exit and mixed recent returns leave a sharper question for investors: Does the current share price fairly reflect that breadth, or not?
Price-to-earnings of 18.3x for U-NEXT HOLDINGSLtd: Is it justified?
On valuation, the market is currently assigning U-NEXT HOLDINGSLtd a P/E of 18.3x, which leaves the stock looking expensive relative to both peers and an estimated fair level, even with the recent share price at ¥1,798.
The P/E ratio compares the share price to earnings per share, so a higher figure usually reflects investors paying more for each unit of profit. For a telecom and services group like U-NEXT HOLDINGSLtd, that often signals the market pricing in steady earnings growth, a resilient earnings profile, or a mix of businesses that investors view as relatively attractive.
That premium is not small. The P/E of 18.3x sits above the peer average of 13.3x and the broader Asian telecom sector average of 15.9x. This points to investors paying a significantly higher multiple than typical for similar companies. Compared with an estimated fair P/E of 15x, the gap is even clearer. This suggests that if sentiment cools, the valuation multiple has room to move closer to that fair level.
Explore the SWS fair ratio for U-NEXT HOLDINGSLtd.
Result: Price-to-earnings of 18.3x (OVERVALUED)
Still, the P/E premium could unwind quickly if U-NEXT HOLDINGS Ltd stumbles on earnings growth expectations, or if sentiment toward telecom and services valuations cools.
Find out about the key risks to this U-NEXT HOLDINGSLtd narrative.
Another view on U-NEXT HOLDINGSLtd’s value
The P/E discussion paints U-NEXT HOLDINGSLtd as expensive, and the SWS DCF model points in the same direction. At ¥1,798 the shares trade above an estimated future cash flow value of ¥1,407.64. That gap implies investors are paying up for the story. Is the underlying cash generation strong enough to warrant that?
Look into how the SWS DCF model arrives at its fair value.
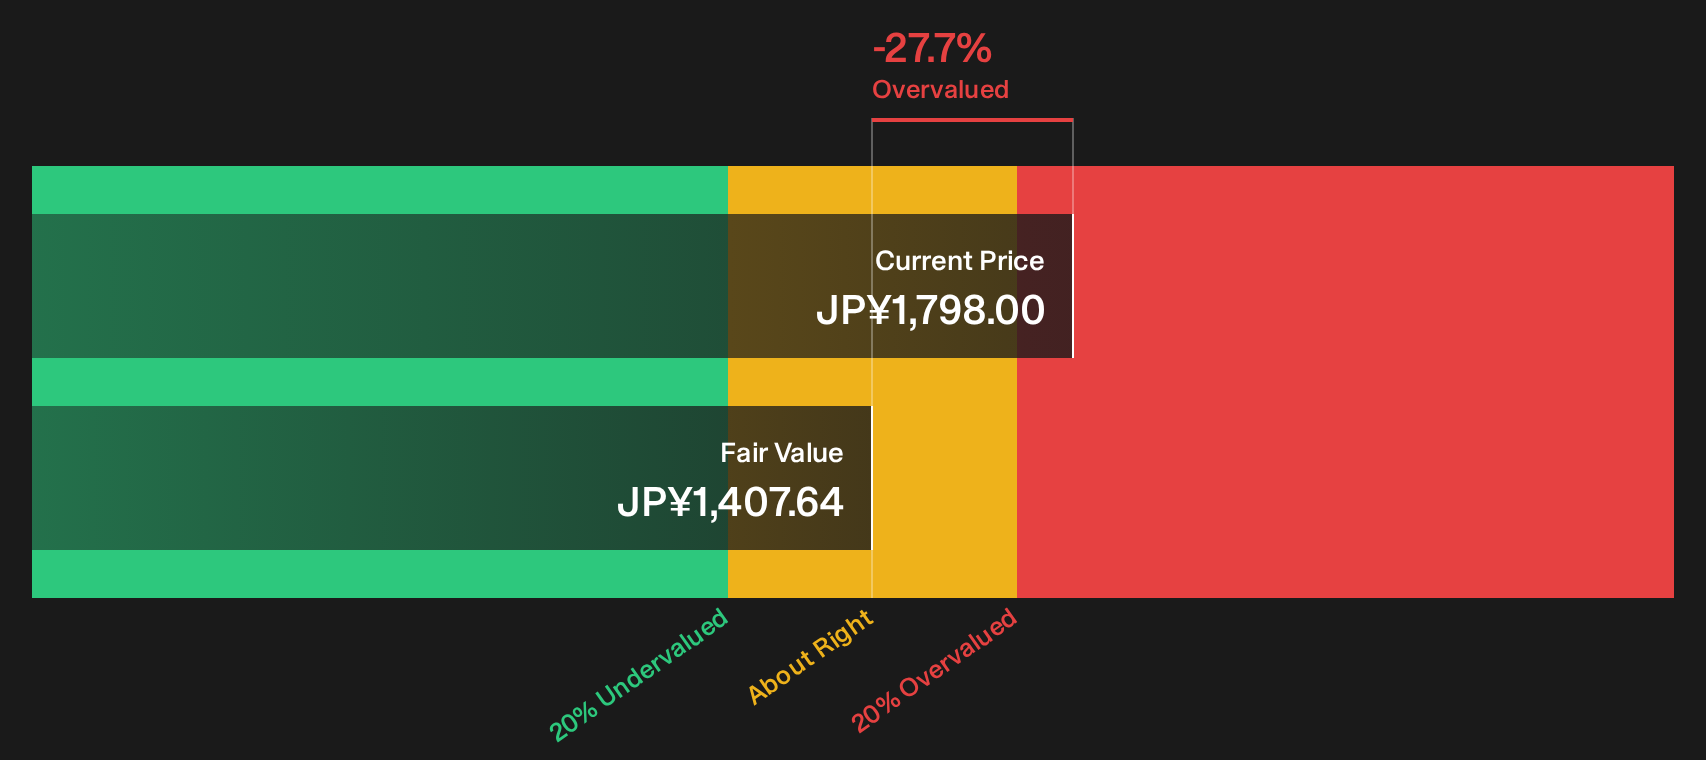
Simply Wall St performs a discounted cash flow (DCF) on every stock in the world every day (check out U-NEXT HOLDINGSLtd for example). We show the entire calculation in full. You can track the result in your watchlist or portfolio and be alerted when this changes, or use our stock screener to discover 19 high quality undervalued stocks. If you save a screener we even alert you when new companies match - so you never miss a potential opportunity.
Next Steps
So after all this, does U-NEXT HOLDINGS Ltd look too expensive or fairly rewarded for its strengths? Act quickly, review the optimistic factors in detail, and pressure test your thesis against the 2 key rewards.
Looking for more investment ideas beyond U-NEXT HOLDINGSLtd?
If U-NEXT HOLDINGSLtd has sharpened your focus on valuation and risk, use that momentum to review fresh ideas that might better fit your goals today.
- Spot potential bargains early by scanning a curated 19 high quality undervalued stocks that combine quality fundamentals with compressed valuations.
- Prioritise resilience and sleep-at-night balance sheets by reviewing a list of solid balance sheet and fundamentals (22 results) that can better handle shocks.
- Lock in potential income streams by assessing a focused 14 dividend fortresses that targets higher-yielding payers with staying power.
This article by Simply Wall St is general in nature. We provide commentary based on historical data and analyst forecasts only using an unbiased methodology and our articles are not intended to be financial advice. It does not constitute a recommendation to buy or sell any stock, and does not take account of your objectives, or your financial situation. We aim to bring you long-term focused analysis driven by fundamental data. Note that our analysis may not factor in the latest price-sensitive company announcements or qualitative material. Simply Wall St has no position in any stocks mentioned.
Have feedback on this article? Concerned about the content? Get in touch with us directly. Alternatively, email editorial-team@simplywallst.com